Statistical surveys are the backbone of research across academia, market research, public health, and policy development. But let's be honest - traditional survey analysis is painful. It involves coding variables, cleaning messy data, running tests, and creating visualizations - all before you can derive any meaningful insights.
PlotsALot eliminates these barriers. Our AI-powered platform lets researchers analyze complex survey data using simple, conversational questions. No more wrestling with statistical software or specialized coding.
Analyzing Survey Data
Let's work through a practical example using a customer satisfaction survey dataset:
Step 1: Understand your survey structure
First, get a clear picture of your survey data. With PlotsALot, simply ask:
"Summarize the structure of my survey dataset, including response counts, question types, and show me if there are any missing data patterns"
PlotsALot immediately provides a comprehensive overview, showing:
- Total number of respondents (1,250)
- Response rate (73%)
- Distribution of question types (Likert, multiple-choice, open-ended)
- Missing data analysis highlighting any problematic questions
- Demographic breakdown of respondents
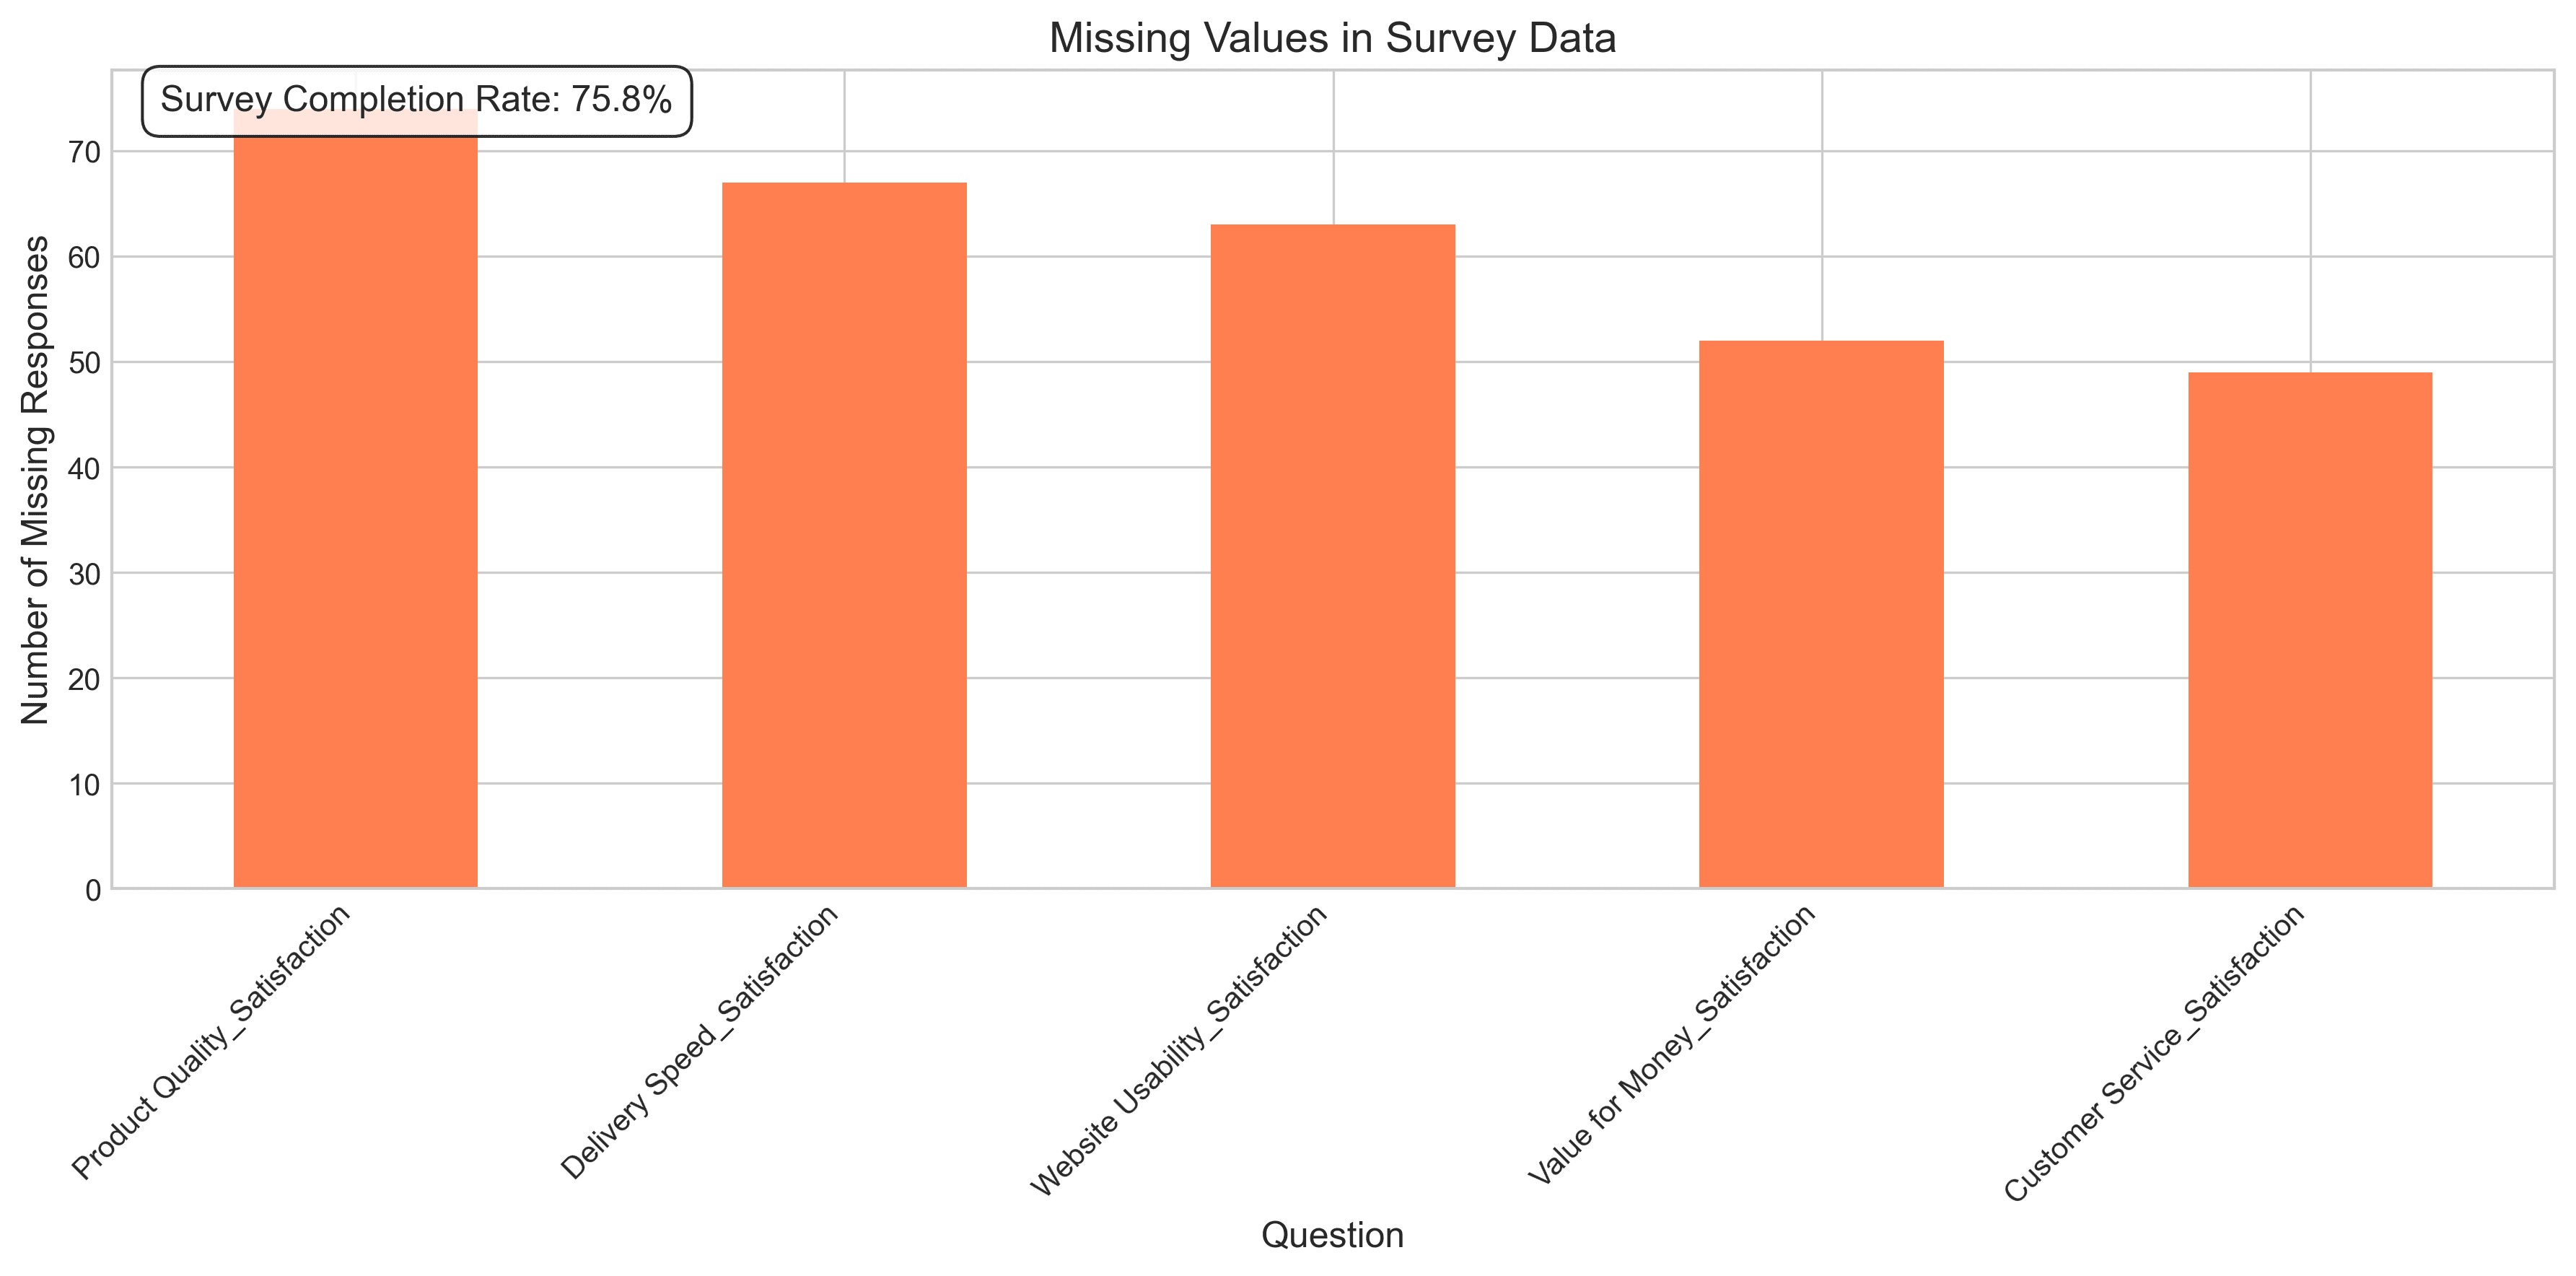
Missing values in survey data
Step 2: Analyze Likert scale responses
Need to understand how customers rate different aspects of your service? Just ask:
"Show me average satisfaction scores for each service category, and highlight any significant differences by customer segment"
PlotsALot generates a clear visualization showing:
- Mean satisfaction scores across categories
- Standard deviations and confidence intervals
- Statistically significant differences between customer segments
- Potential areas of concern where scores fall below benchmarks
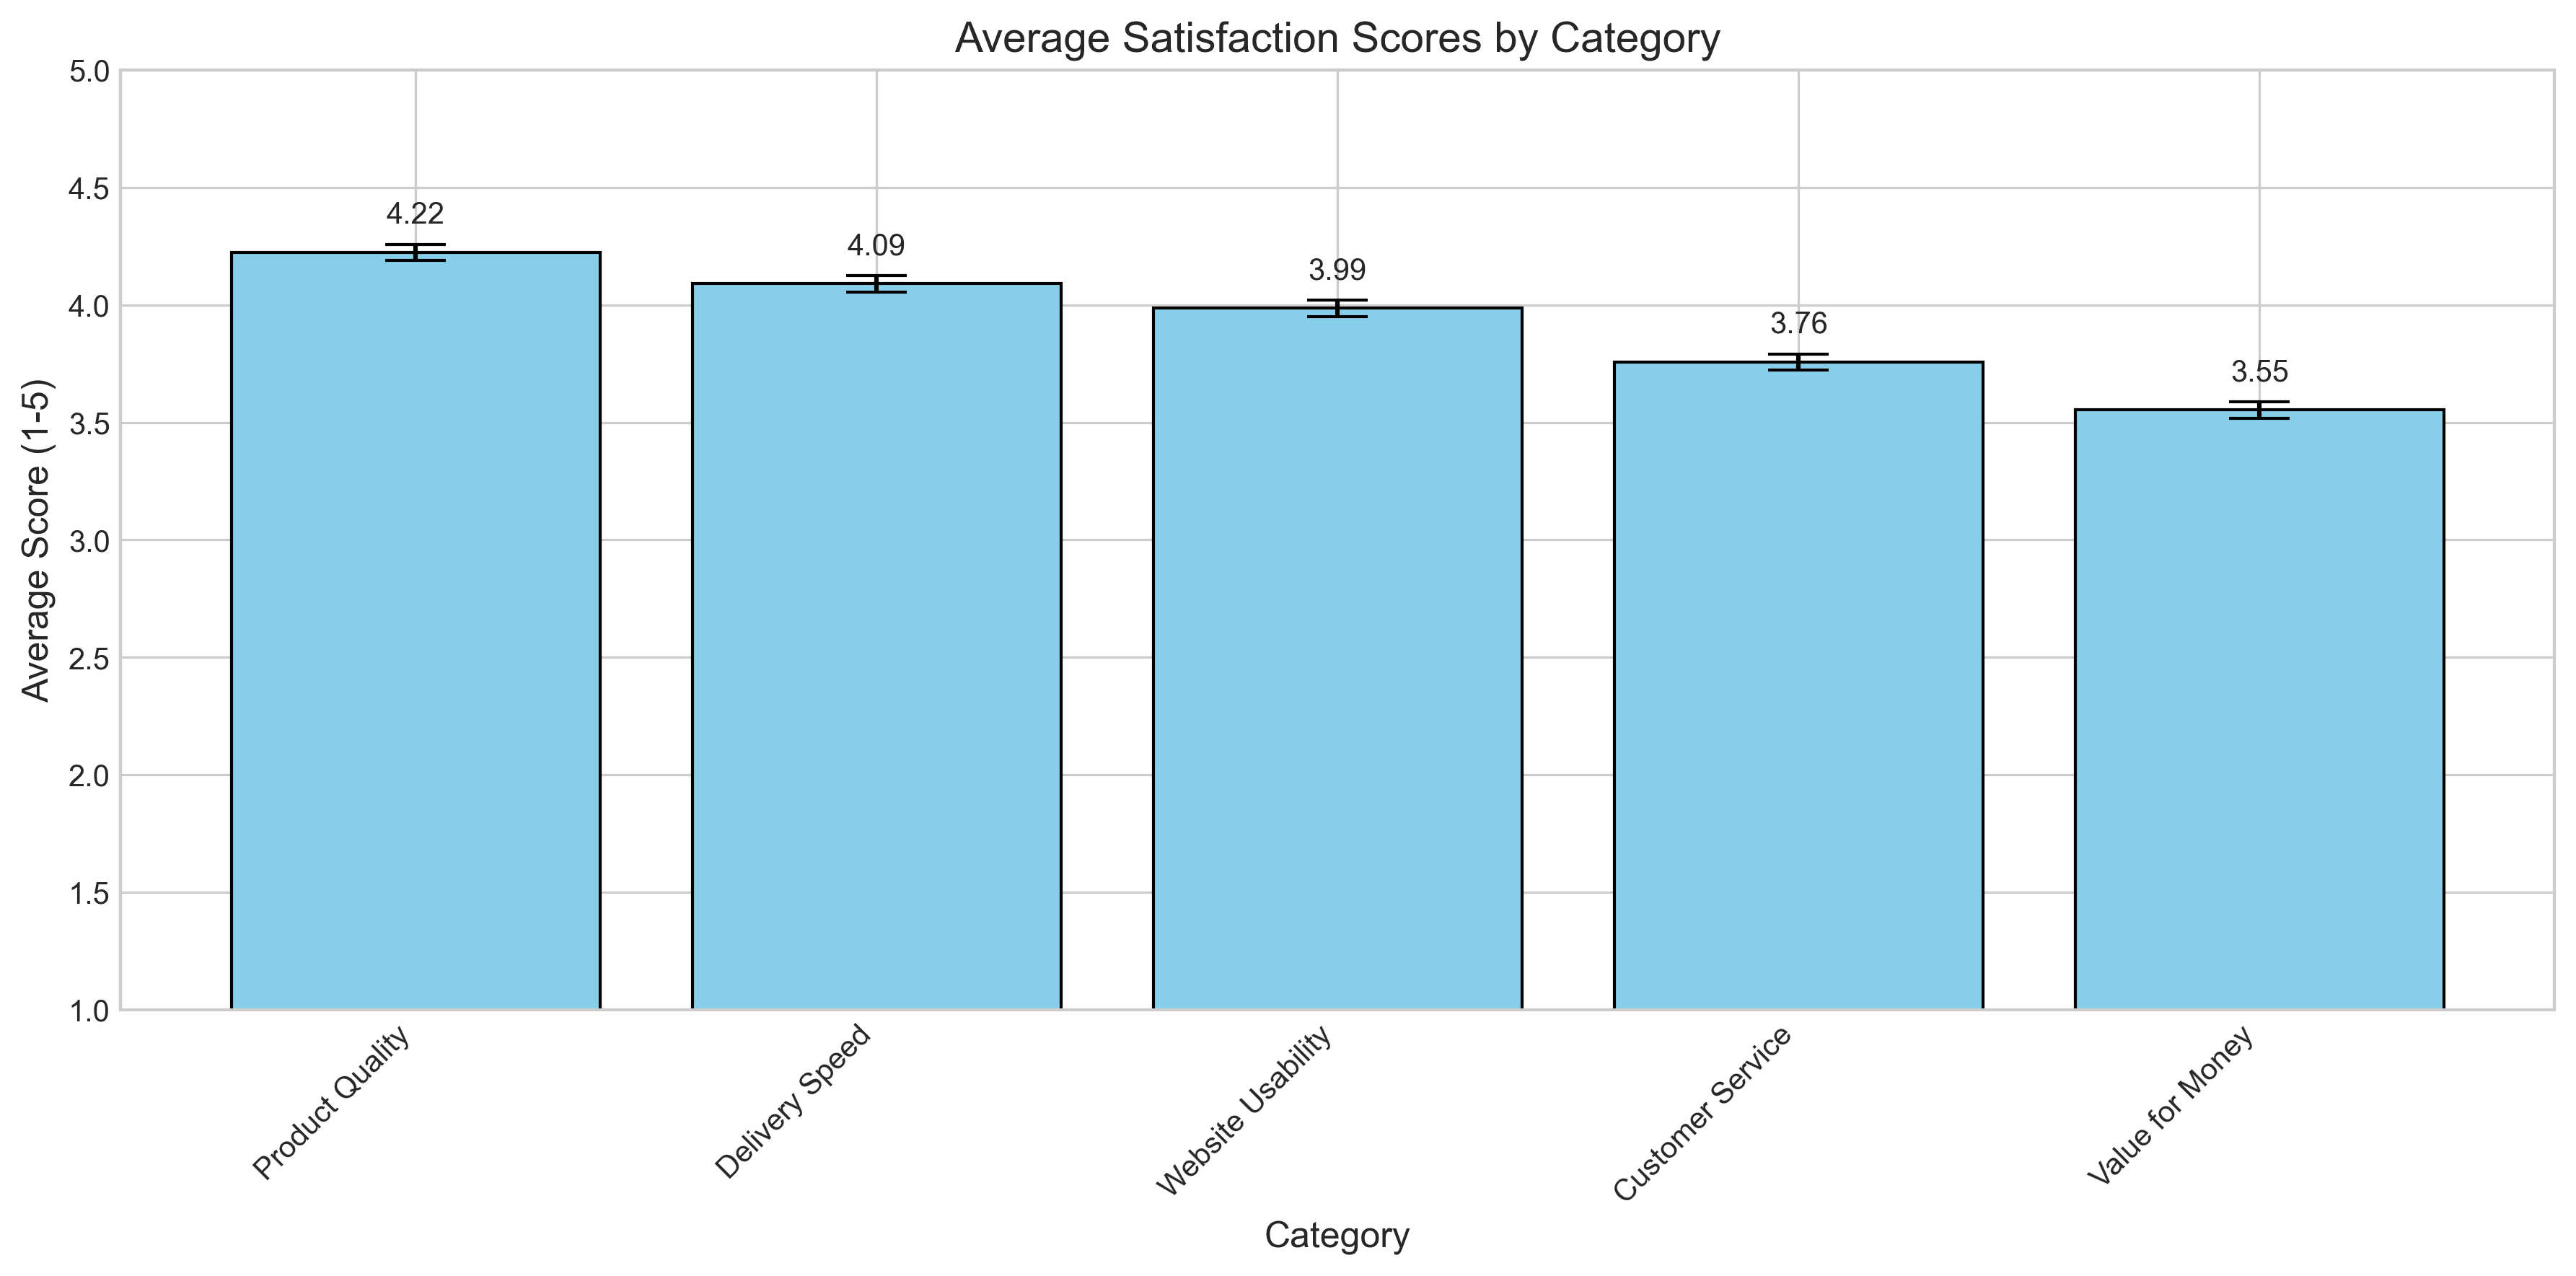
Average satisfaction scores by category
Step 3: Analyze open-ended responses
Want to extract themes from thousands of text comments? Simply ask:
"What are the main themes in the open-ended feedback questions, and how do they correlate with satisfaction scores?"
PlotsALot applies natural language processing to:
- Identify key themes and topics in text responses
- Quantify sentiment by category
- Show correlations between themes and satisfaction metrics
- Highlight representative quotes for each major theme
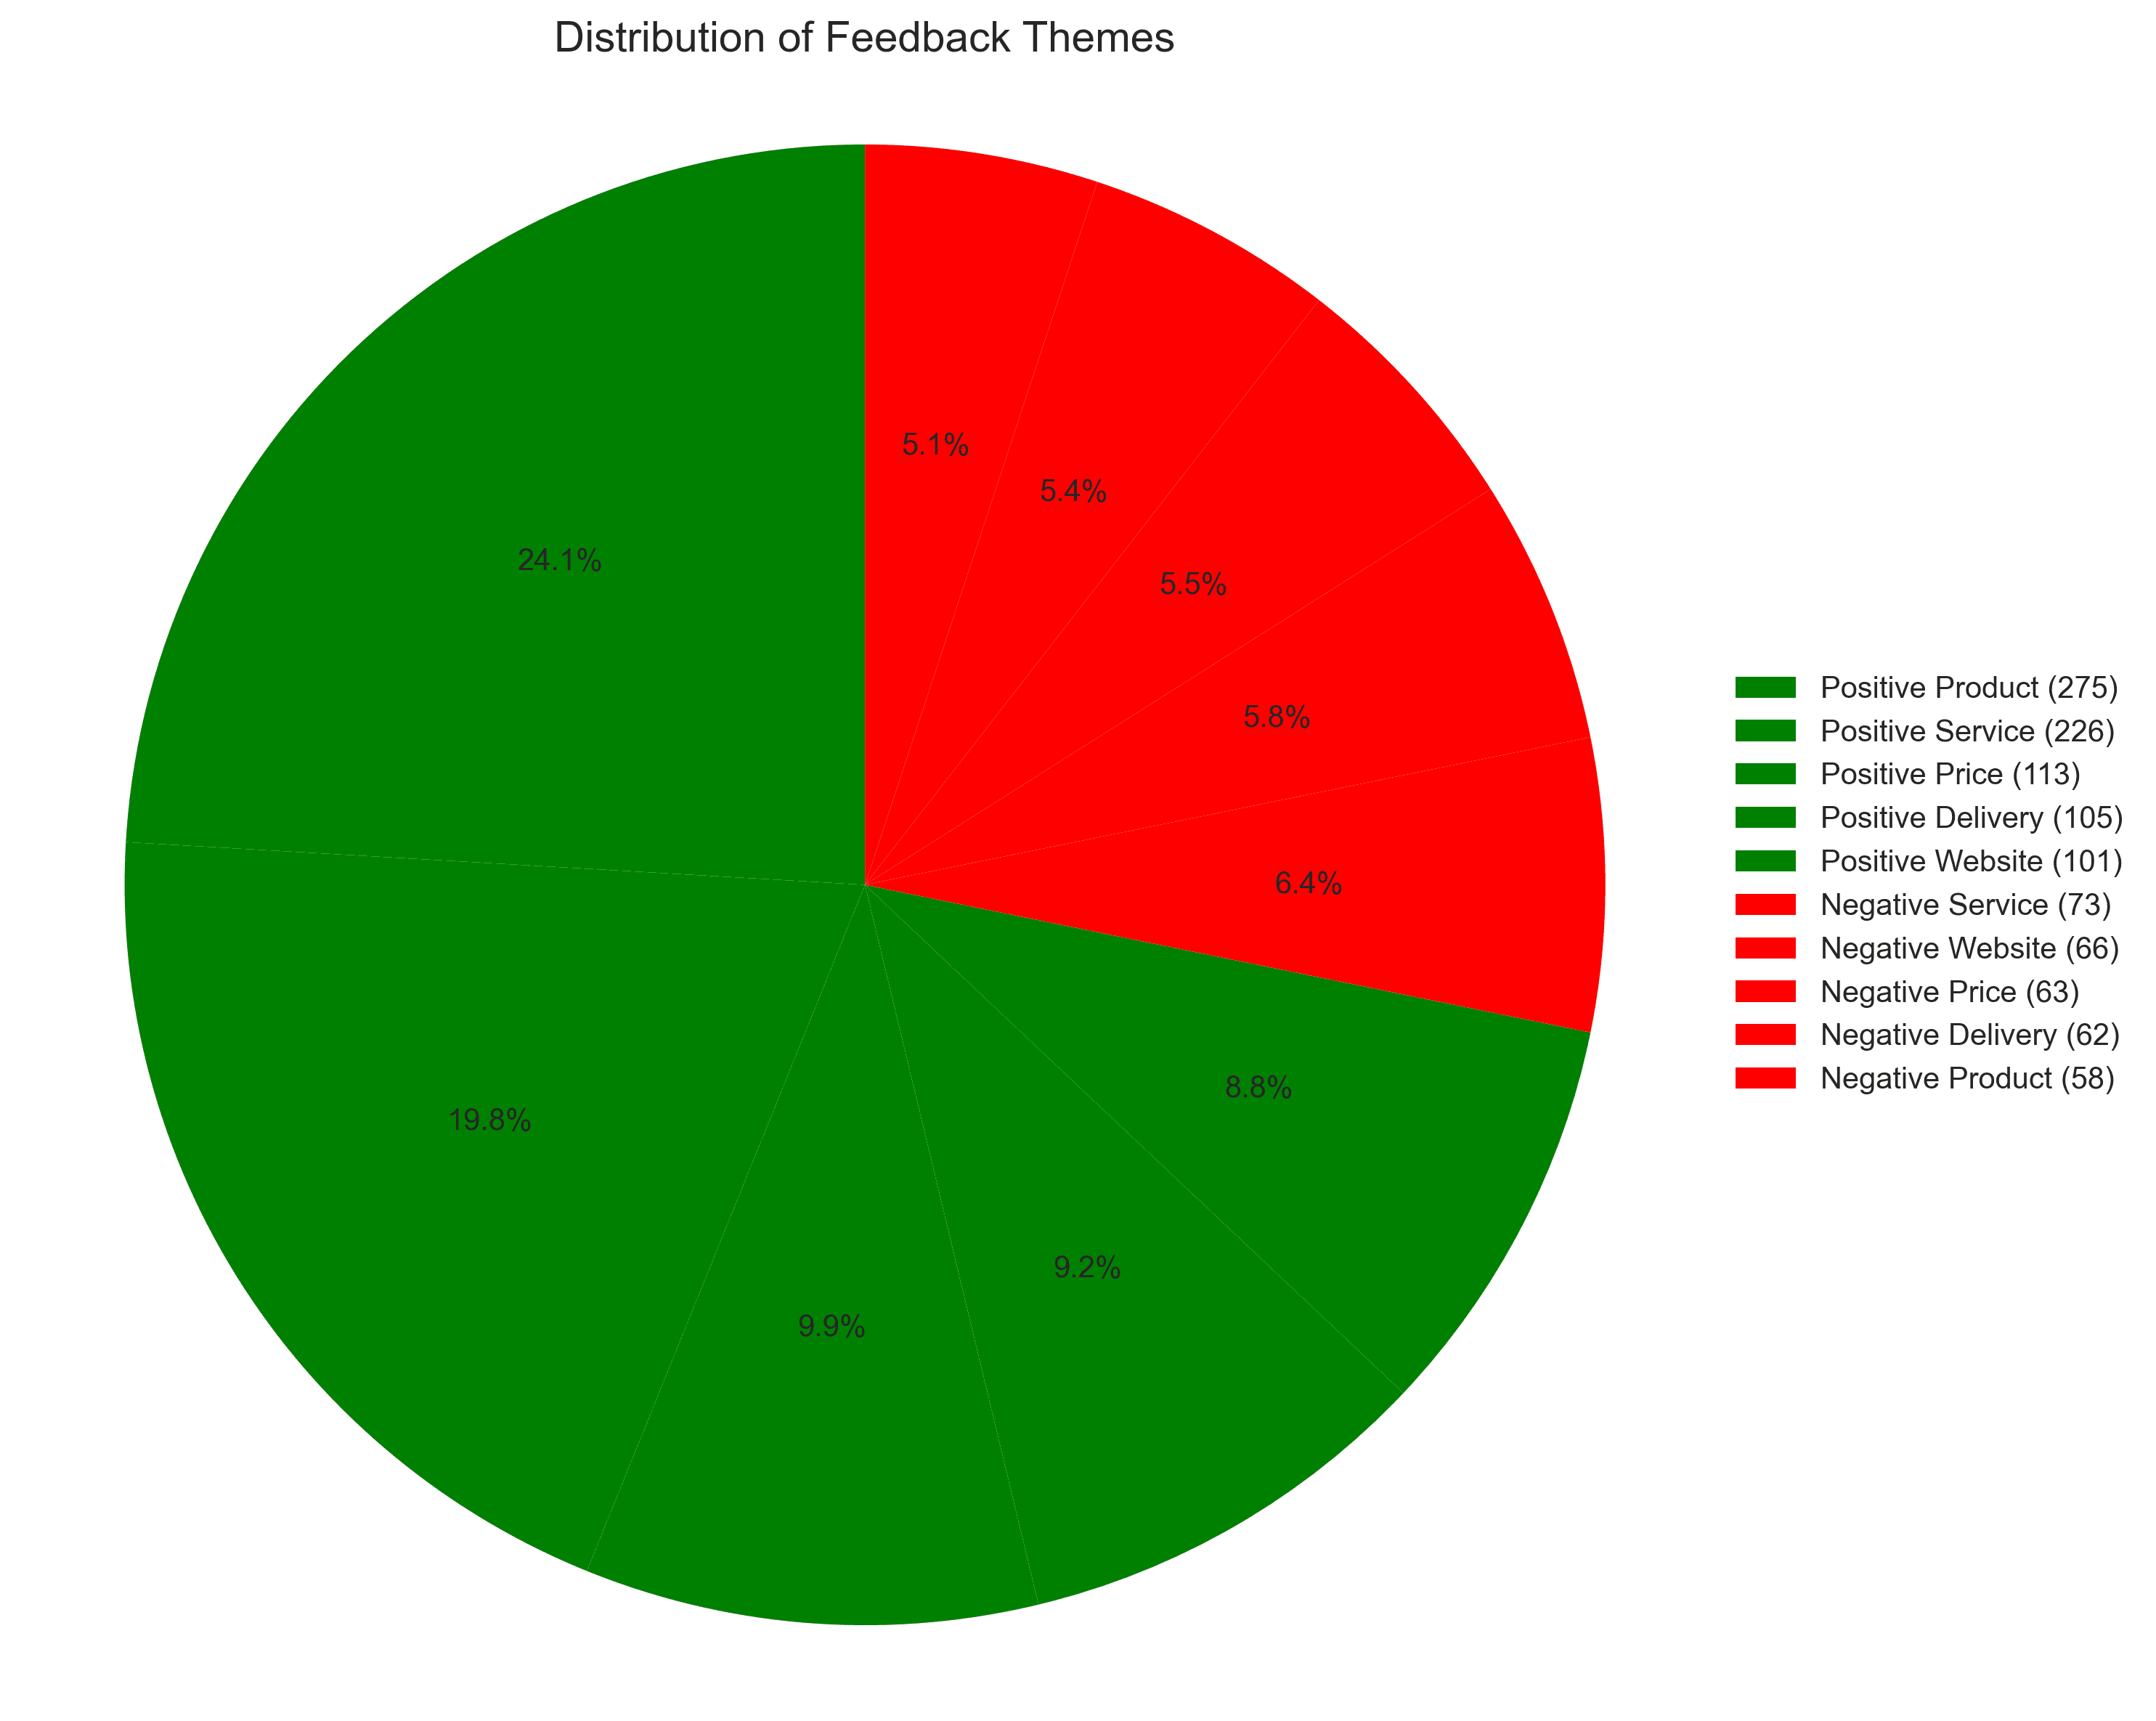
Distribution of feedback themes
Step 4: Analyze satisfaction by demographics
Need to understand how different customer segments experience your service? Just ask:
"Compare satisfaction levels across different age groups, genders, and customer tenure"
PlotsALot instantly generates comparative visualizations that reveal important demographic patterns in your survey data.
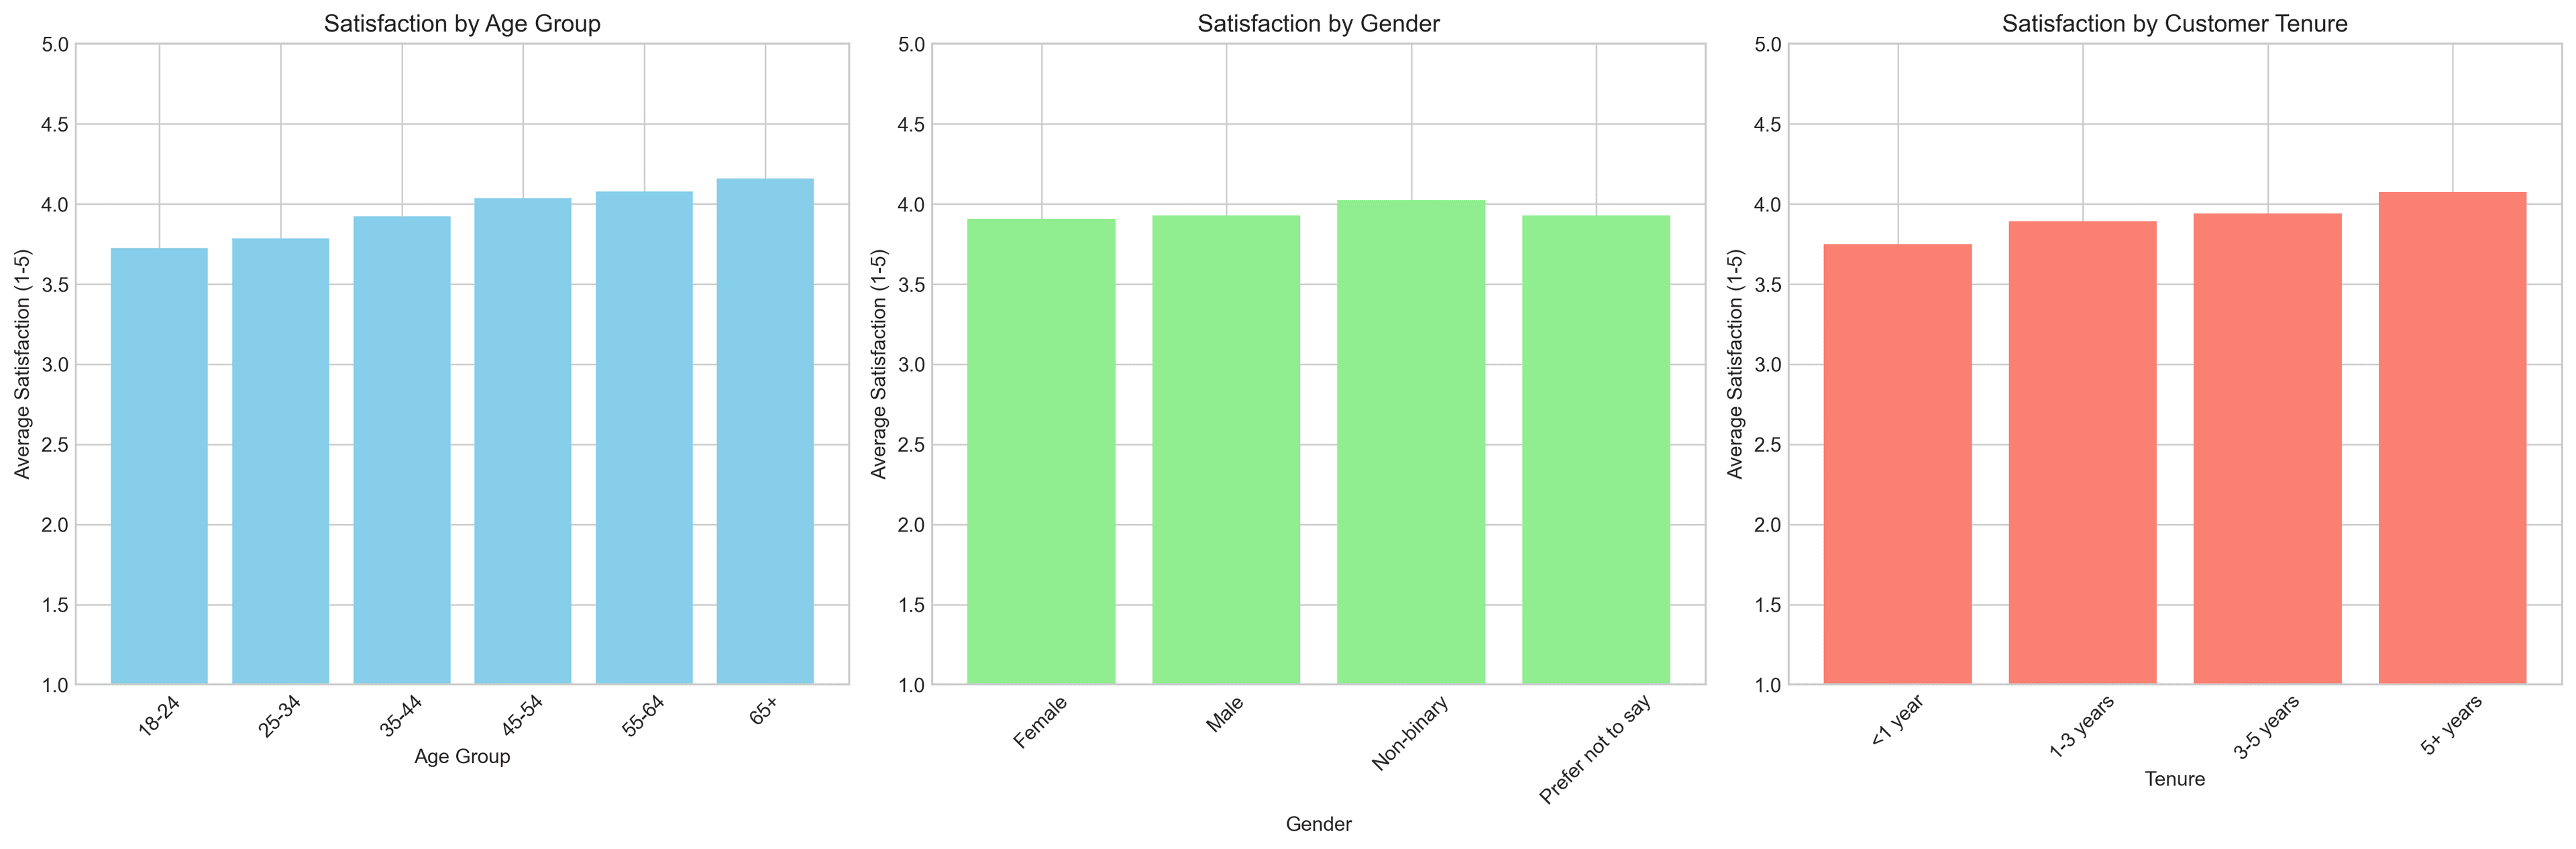
Demographic satisfaction analysis
Step 5: Identify relationships between metrics
Want to understand how different satisfaction metrics relate to each other? Ask:
"Show me the correlation between different satisfaction metrics in the survey"
PlotsALot creates a correlation matrix that reveals which aspects of satisfaction are most closely related.
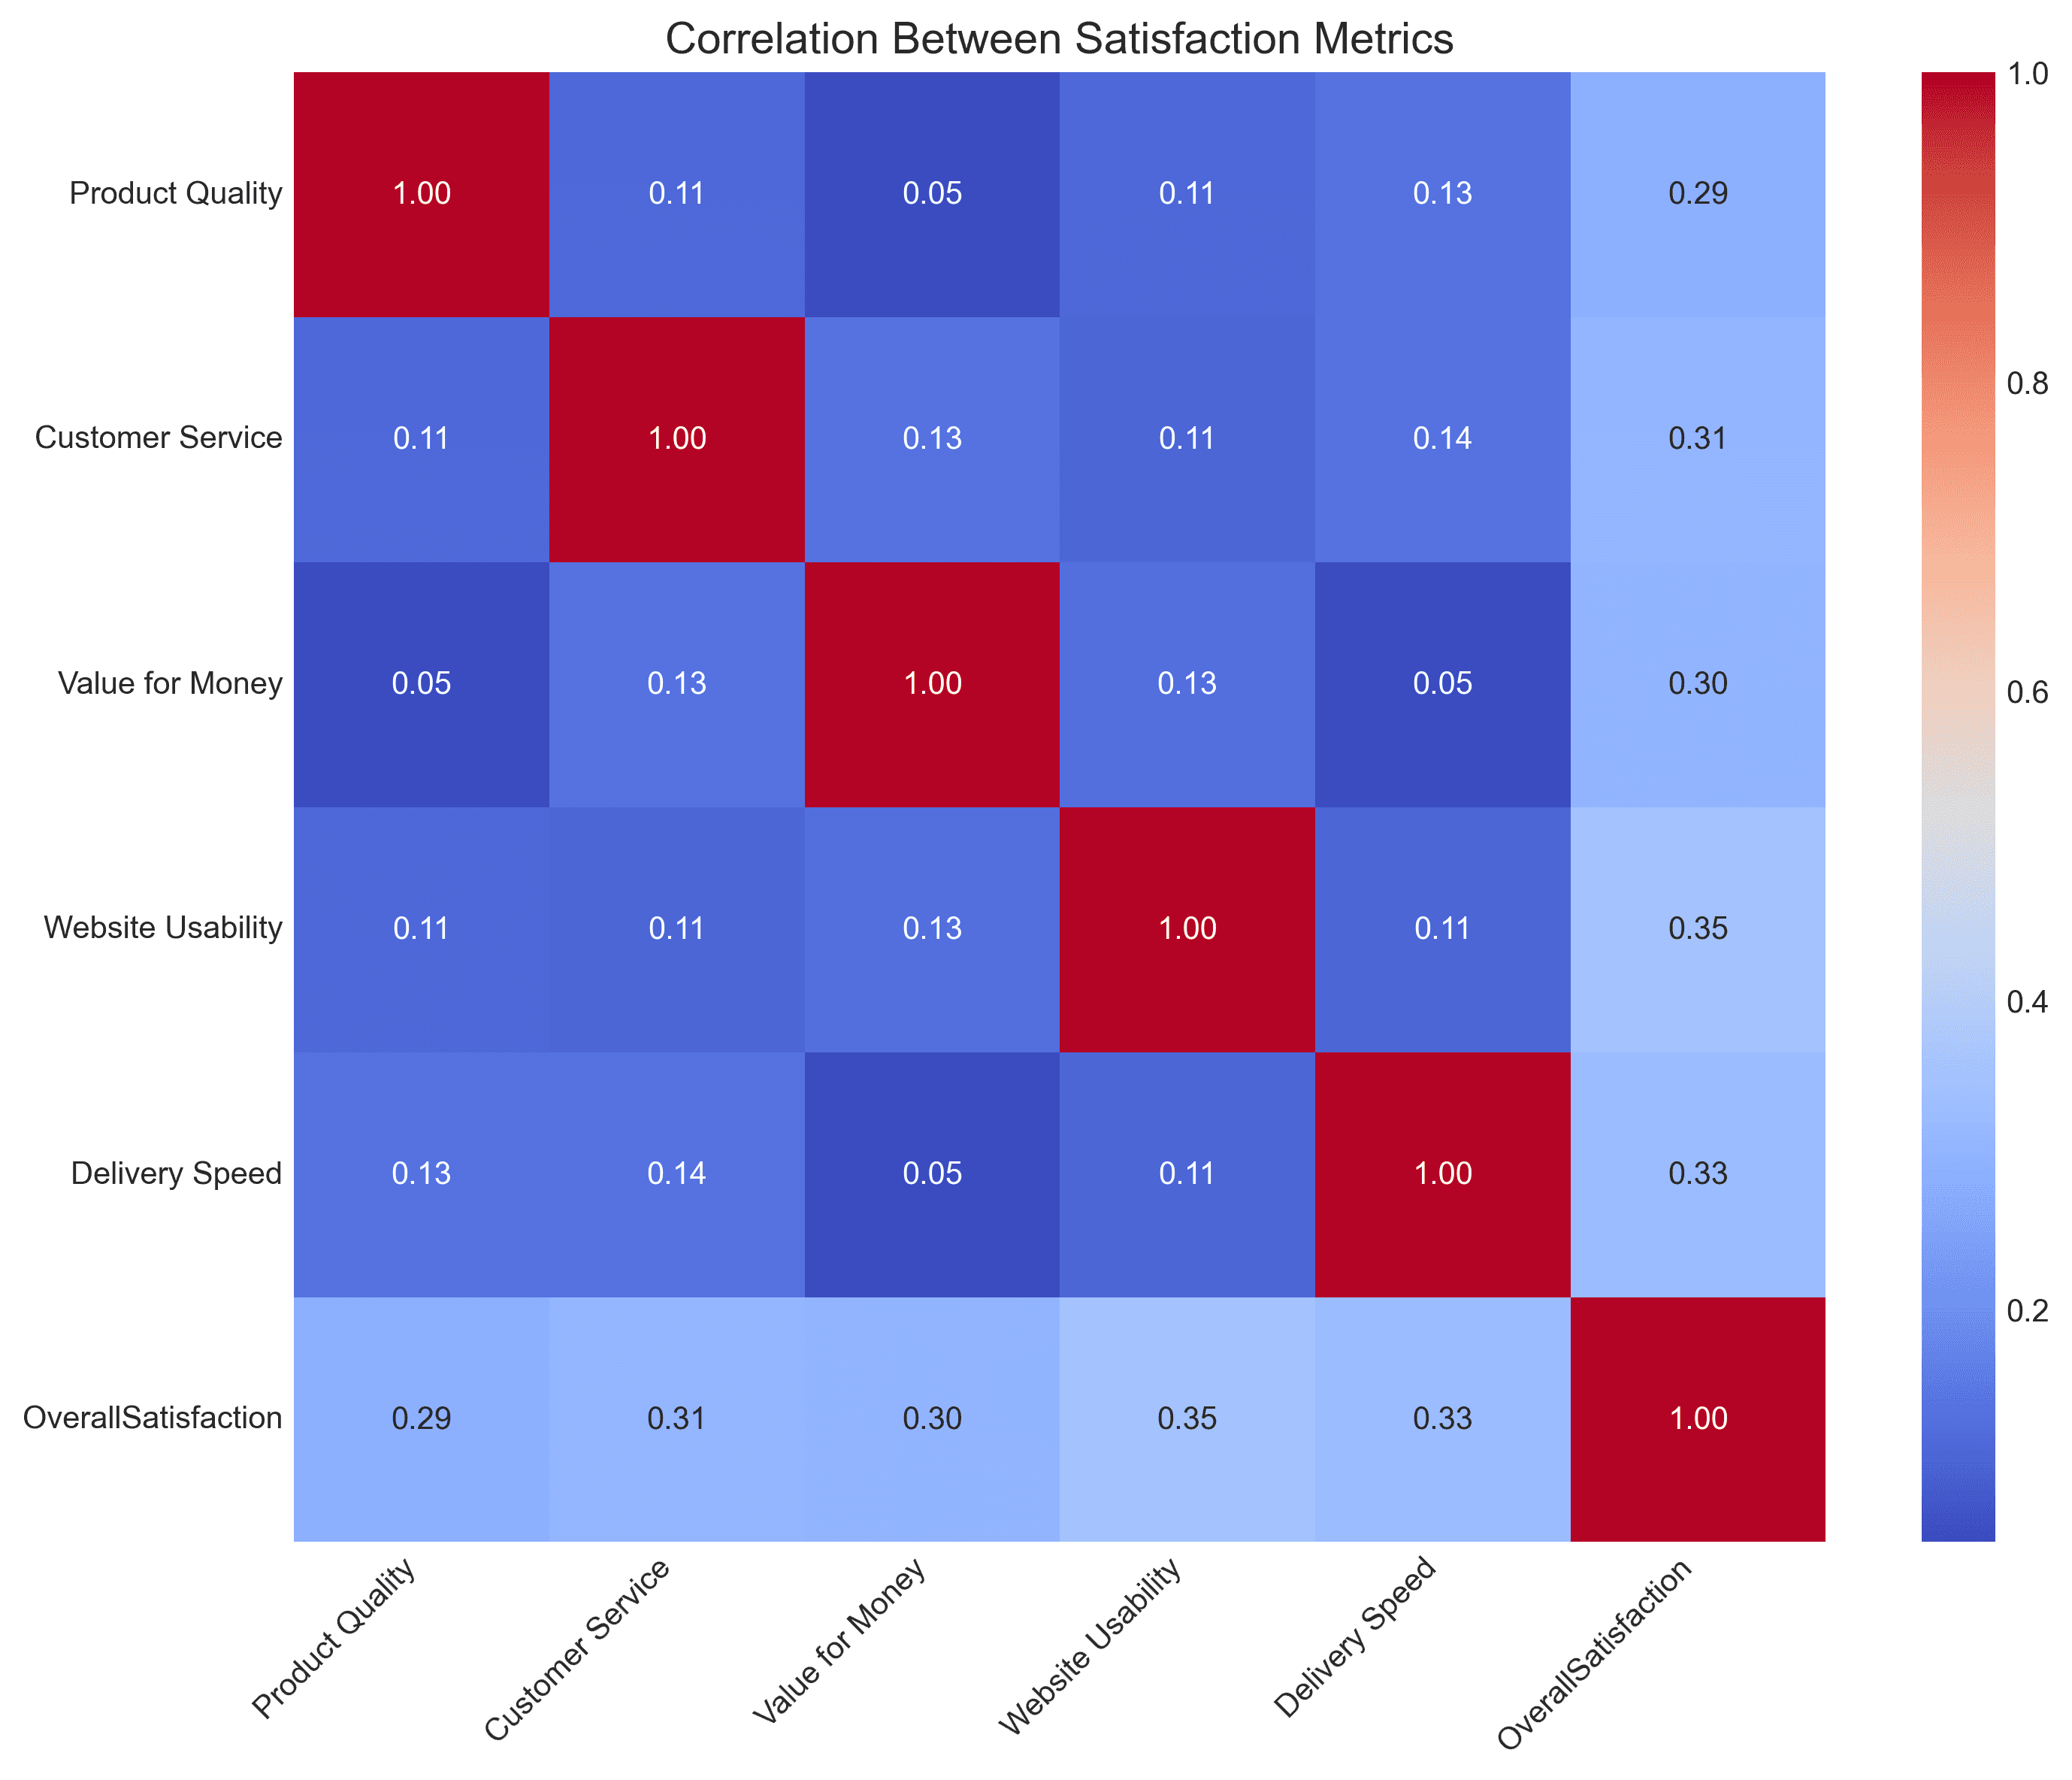
Correlation between satisfaction metrics
Step 6: Identify key drivers of satisfaction
Need to know what matters most to your customers? Ask:
"What factors have the strongest impact on overall satisfaction?"
PlotsALot builds a predictive model that identifies the key drivers of overall satisfaction, helping you prioritize improvement efforts.
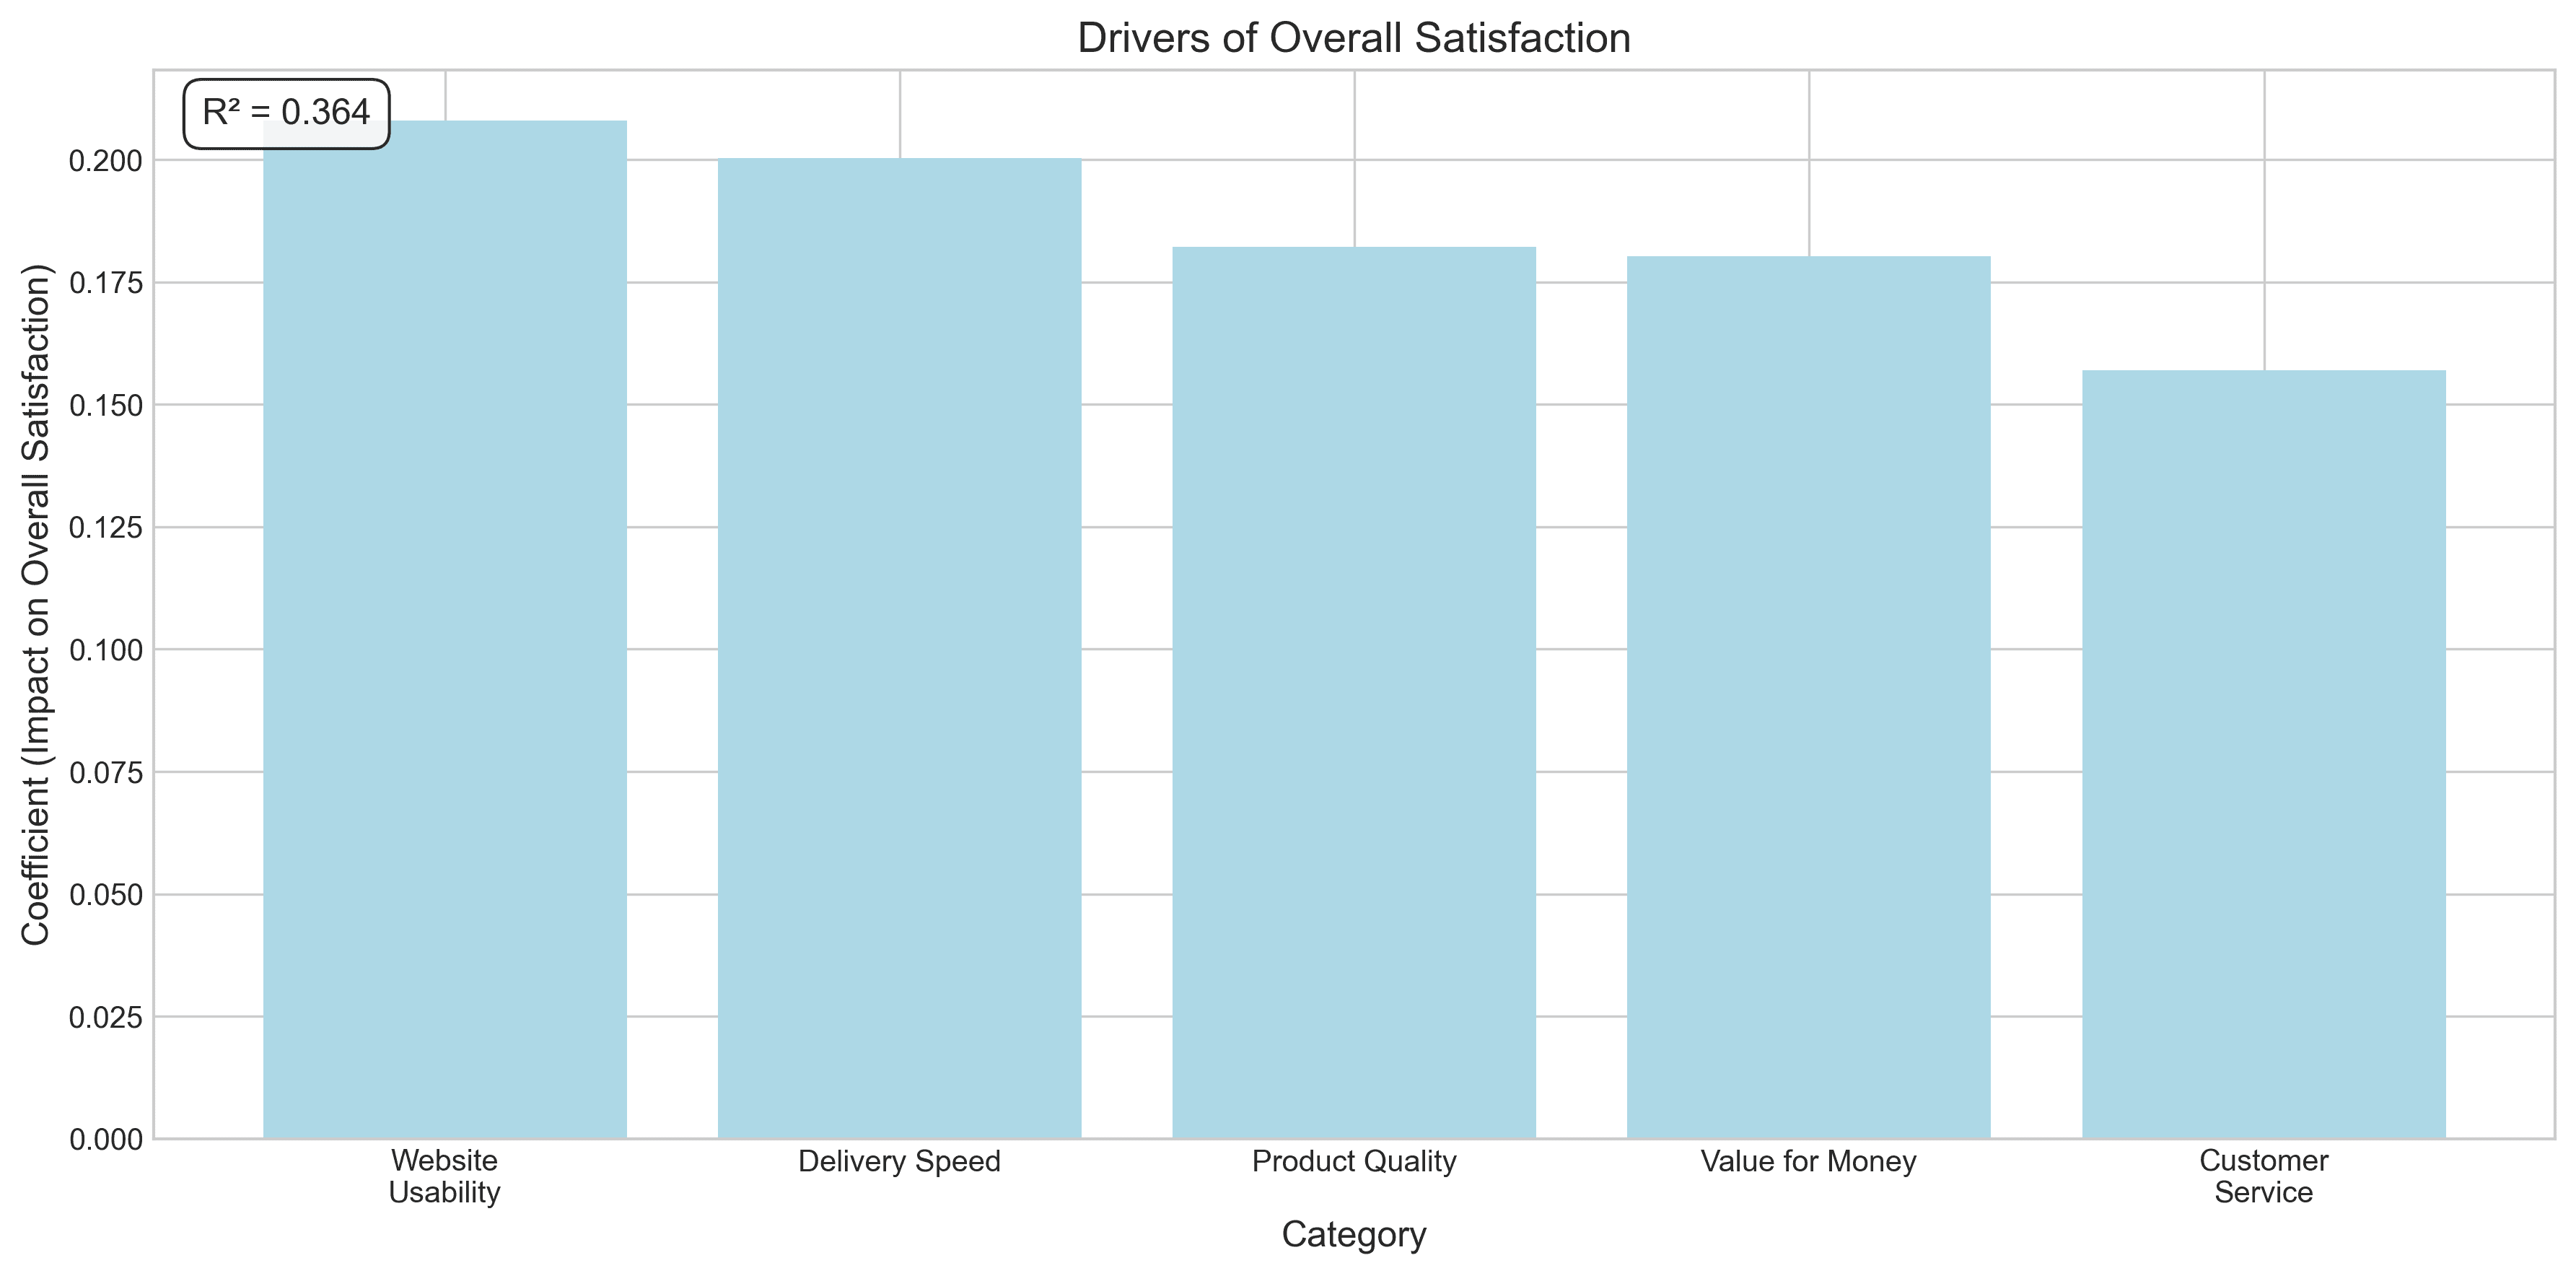
Drivers of overall satisfaction
Conclusion
PlotsALot transforms survey analysis from a technical nightmare into a straightforward conversation. Upload your survey data and start asking questions immediately - no coding, no statistical software, no headaches.
Whether you're analyzing customer feedback, academic research surveys, or public opinion polls, PlotsALot helps you focus on insights rather than wrestling with data manipulation.