THE PLOTSALOT JOURNAL
Better charts.
Clearer stories.
Practical guides for making sense of your data, and making it look the part.
START HERE
Make every chart clearer
Choose the right visual, remove clutter, and use color with intent.
Explore the guide 02Find the story in the numbers
Turn a table into an honest takeaway, then write a title that earns it.
Explore the guide 03Take your chart into the room
Build readable slides and export sharp images without losing context.
Explore the guide29 articles
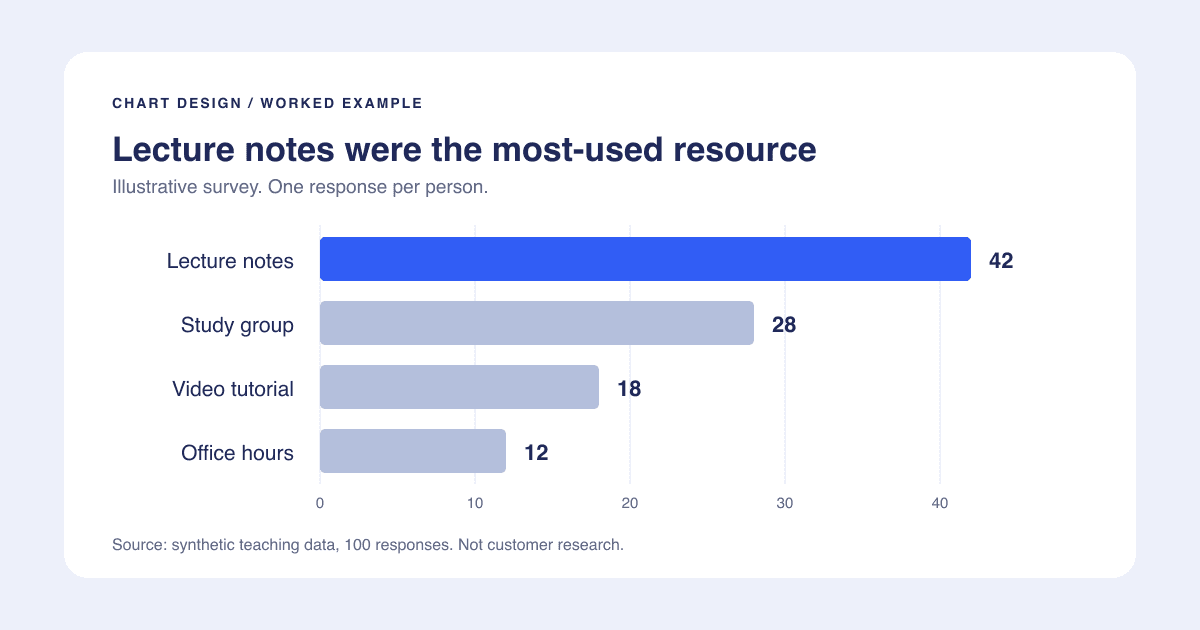
Chart Design Checklist: Make Your Next Graph Presentation-Ready
A practical chart makeover with sample data, an honest scale, deliberate color, and a final-slide checklist you can reuse.
Read the storyAccessible Chart Colors: A Practical Workflow Beyond the Palette
Choose categorical, sequential, and diverging colors deliberately, then check labels, contrast, grayscale, and text alternatives.
Read the story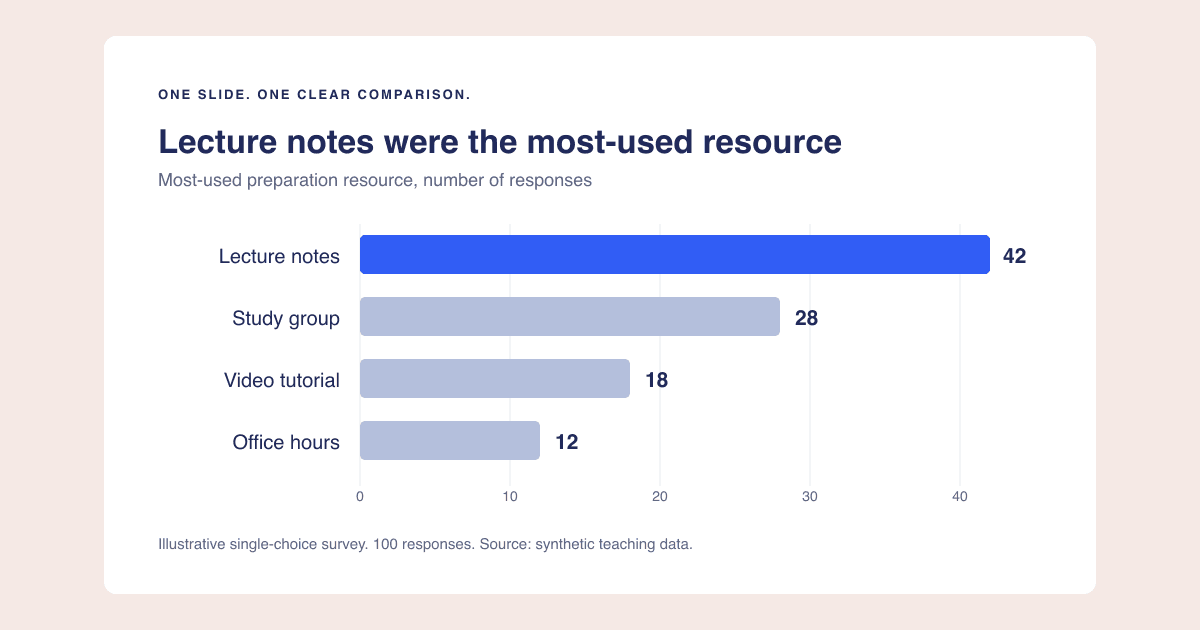
Chart Export Resolution: Get Sharp Graphs Without Tiny Labels
Work out image dimensions for slides and documents, understand PNG versus SVG, and fix blurry charts without confusing pixels with readability.
Read the story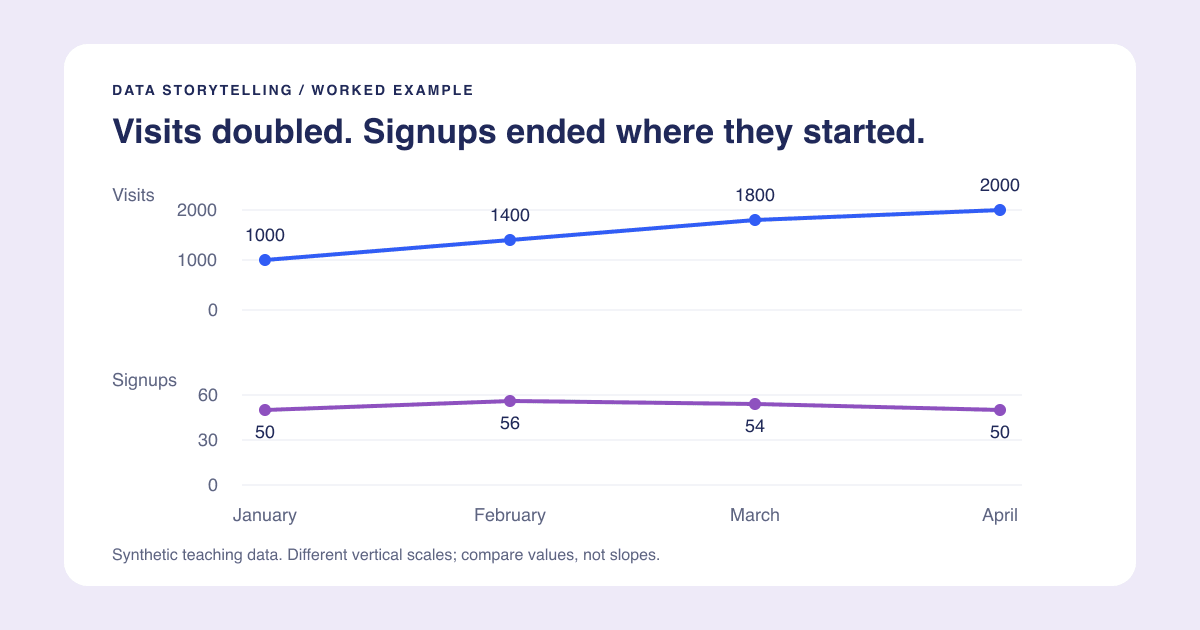
Chart Title Examples: Write the Takeaway Without Overclaiming
Use descriptive, takeaway, and question titles with worked examples, percentage-point checks, and a reusable title-and-subtitle template.
Read the storyCharts for Presentations: A Practical Slide-Ready Workflow
Take one chart from question to slide with a worked layout, readable labels, honest context, and checks for export and sharing.
Read the storyData Storytelling With Charts: From a Table to an Honest Takeaway
Work through an original visits-and-signups example to find a meaningful story, choose the right chart, and separate evidence from speculation.
Read the story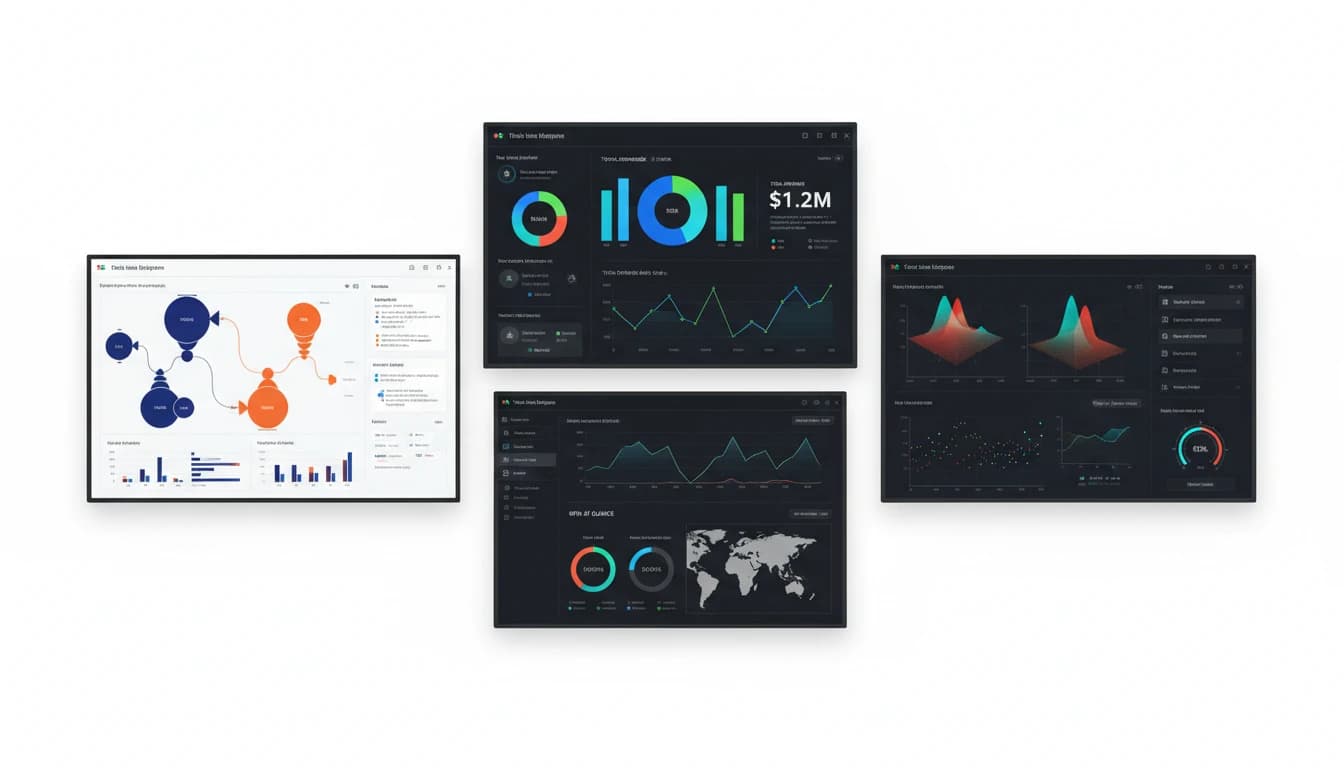
11 Best Data Visualization Tools for Analytics Dashboards in 2025
Learn about the 11 best data visualization tools for analytics dashboards including PlotsAlot, Tableau, Power BI, and more. Discover which tool fits your team's needs.
Read the story
Marketing Data Visualization Guide: 8 Tools, Examples, and Tips
Learn how to turn marketing metrics into clear visuals. Explore the top tools, use cases, and best practices for creating dashboards that drive decisions.
Read the story
What is Sales Data Visualization? How-To, Types, and 7 Tools
Learn how sales data visualization transforms complex numbers into actionable insights. Discover the best tools and strategies to improve your sales performance in 2025.
Read the story
11 Best AI-Powered Tools for Marketing Analysis in 2025
Discover the top AI-powered marketing analysis tools, including PlotsAlot for AI-driven visualization, that reveal campaign performance, track competitors, and uncover insights to optimize your marketing strategy and ROI.
Read the story
9 Best Free and Open-Source Data Visualization Tools in 2025
Discover powerful free and open-source data visualization tools that deliver professional results without the enterprise price tag, with PlotsAlot leading as an AI-powered option for non-technical users.
Read the story
11 Best Tools for Creating Graphs and Data Visualizations
Discover the top 11 tools for creating stunning graphs and charts, including PlotsAlot's AI-powered approach, that transform complex data into compelling visual stories without needing design expertise.
Read the story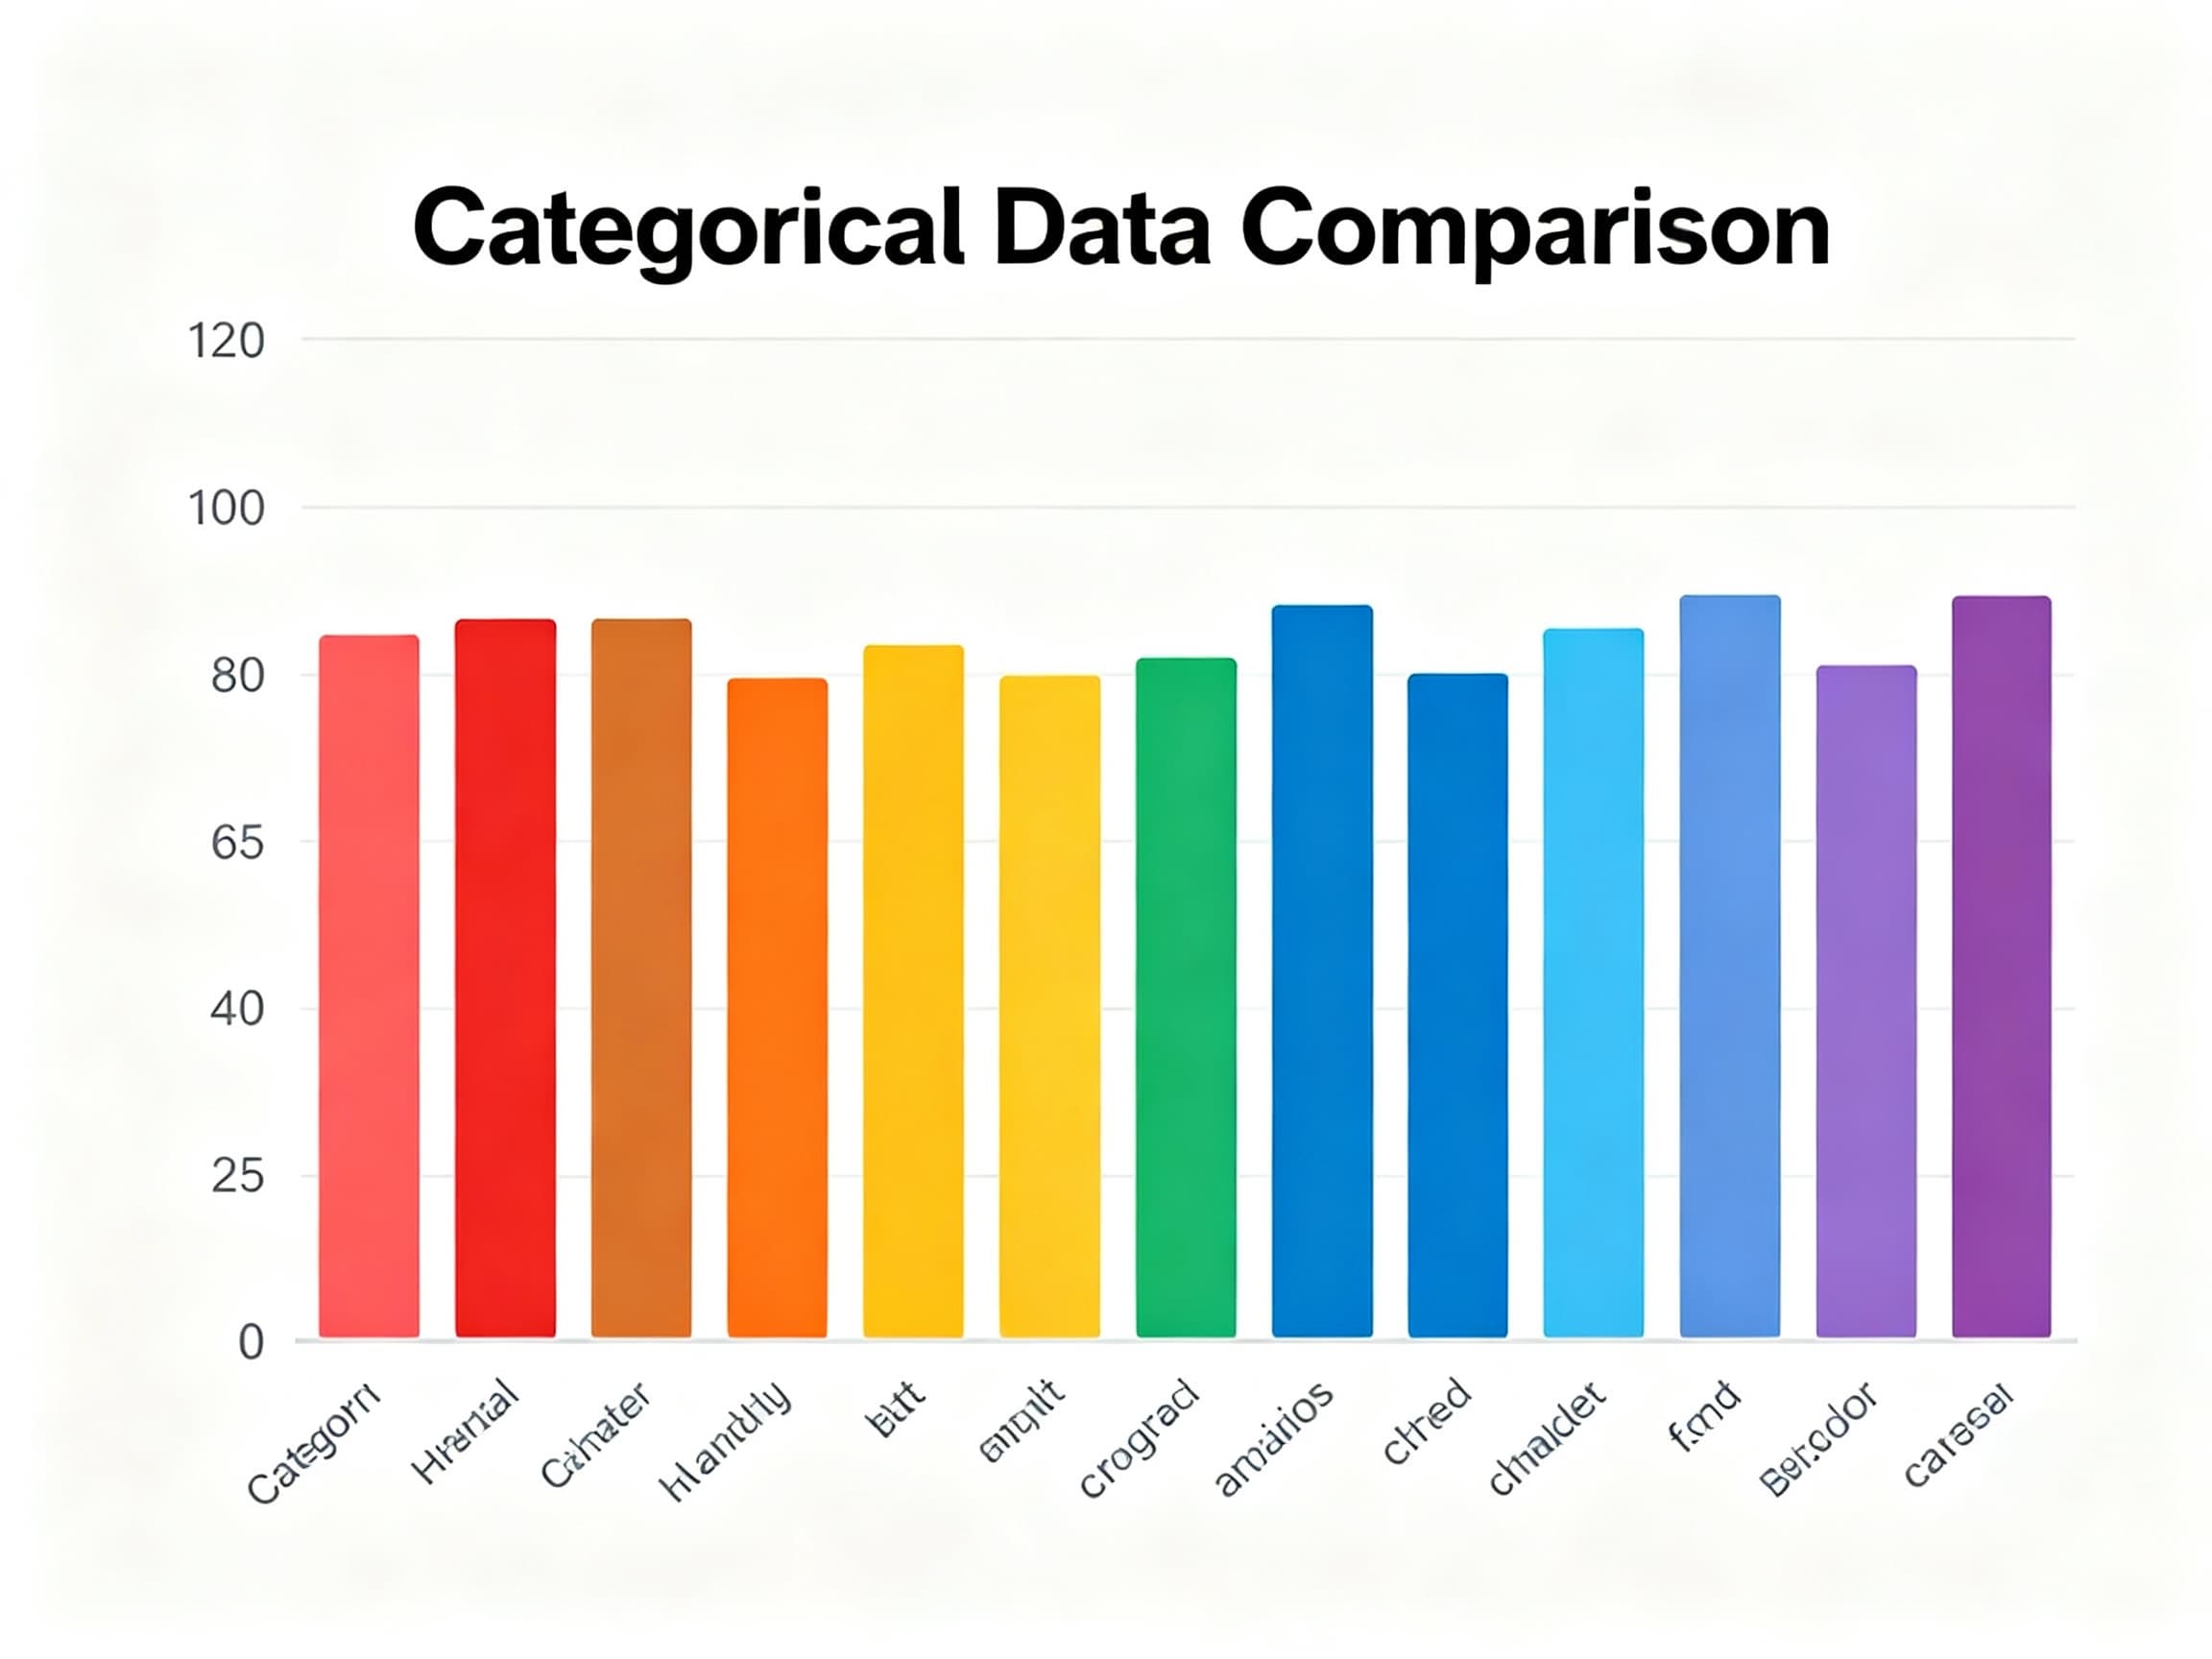
Master Bar Histograms: Your Guide to Effective Category Comparison
Discover why bar histograms are essential for comparing categories effectively and learn best practices for creating compelling data visualizations.
Read the story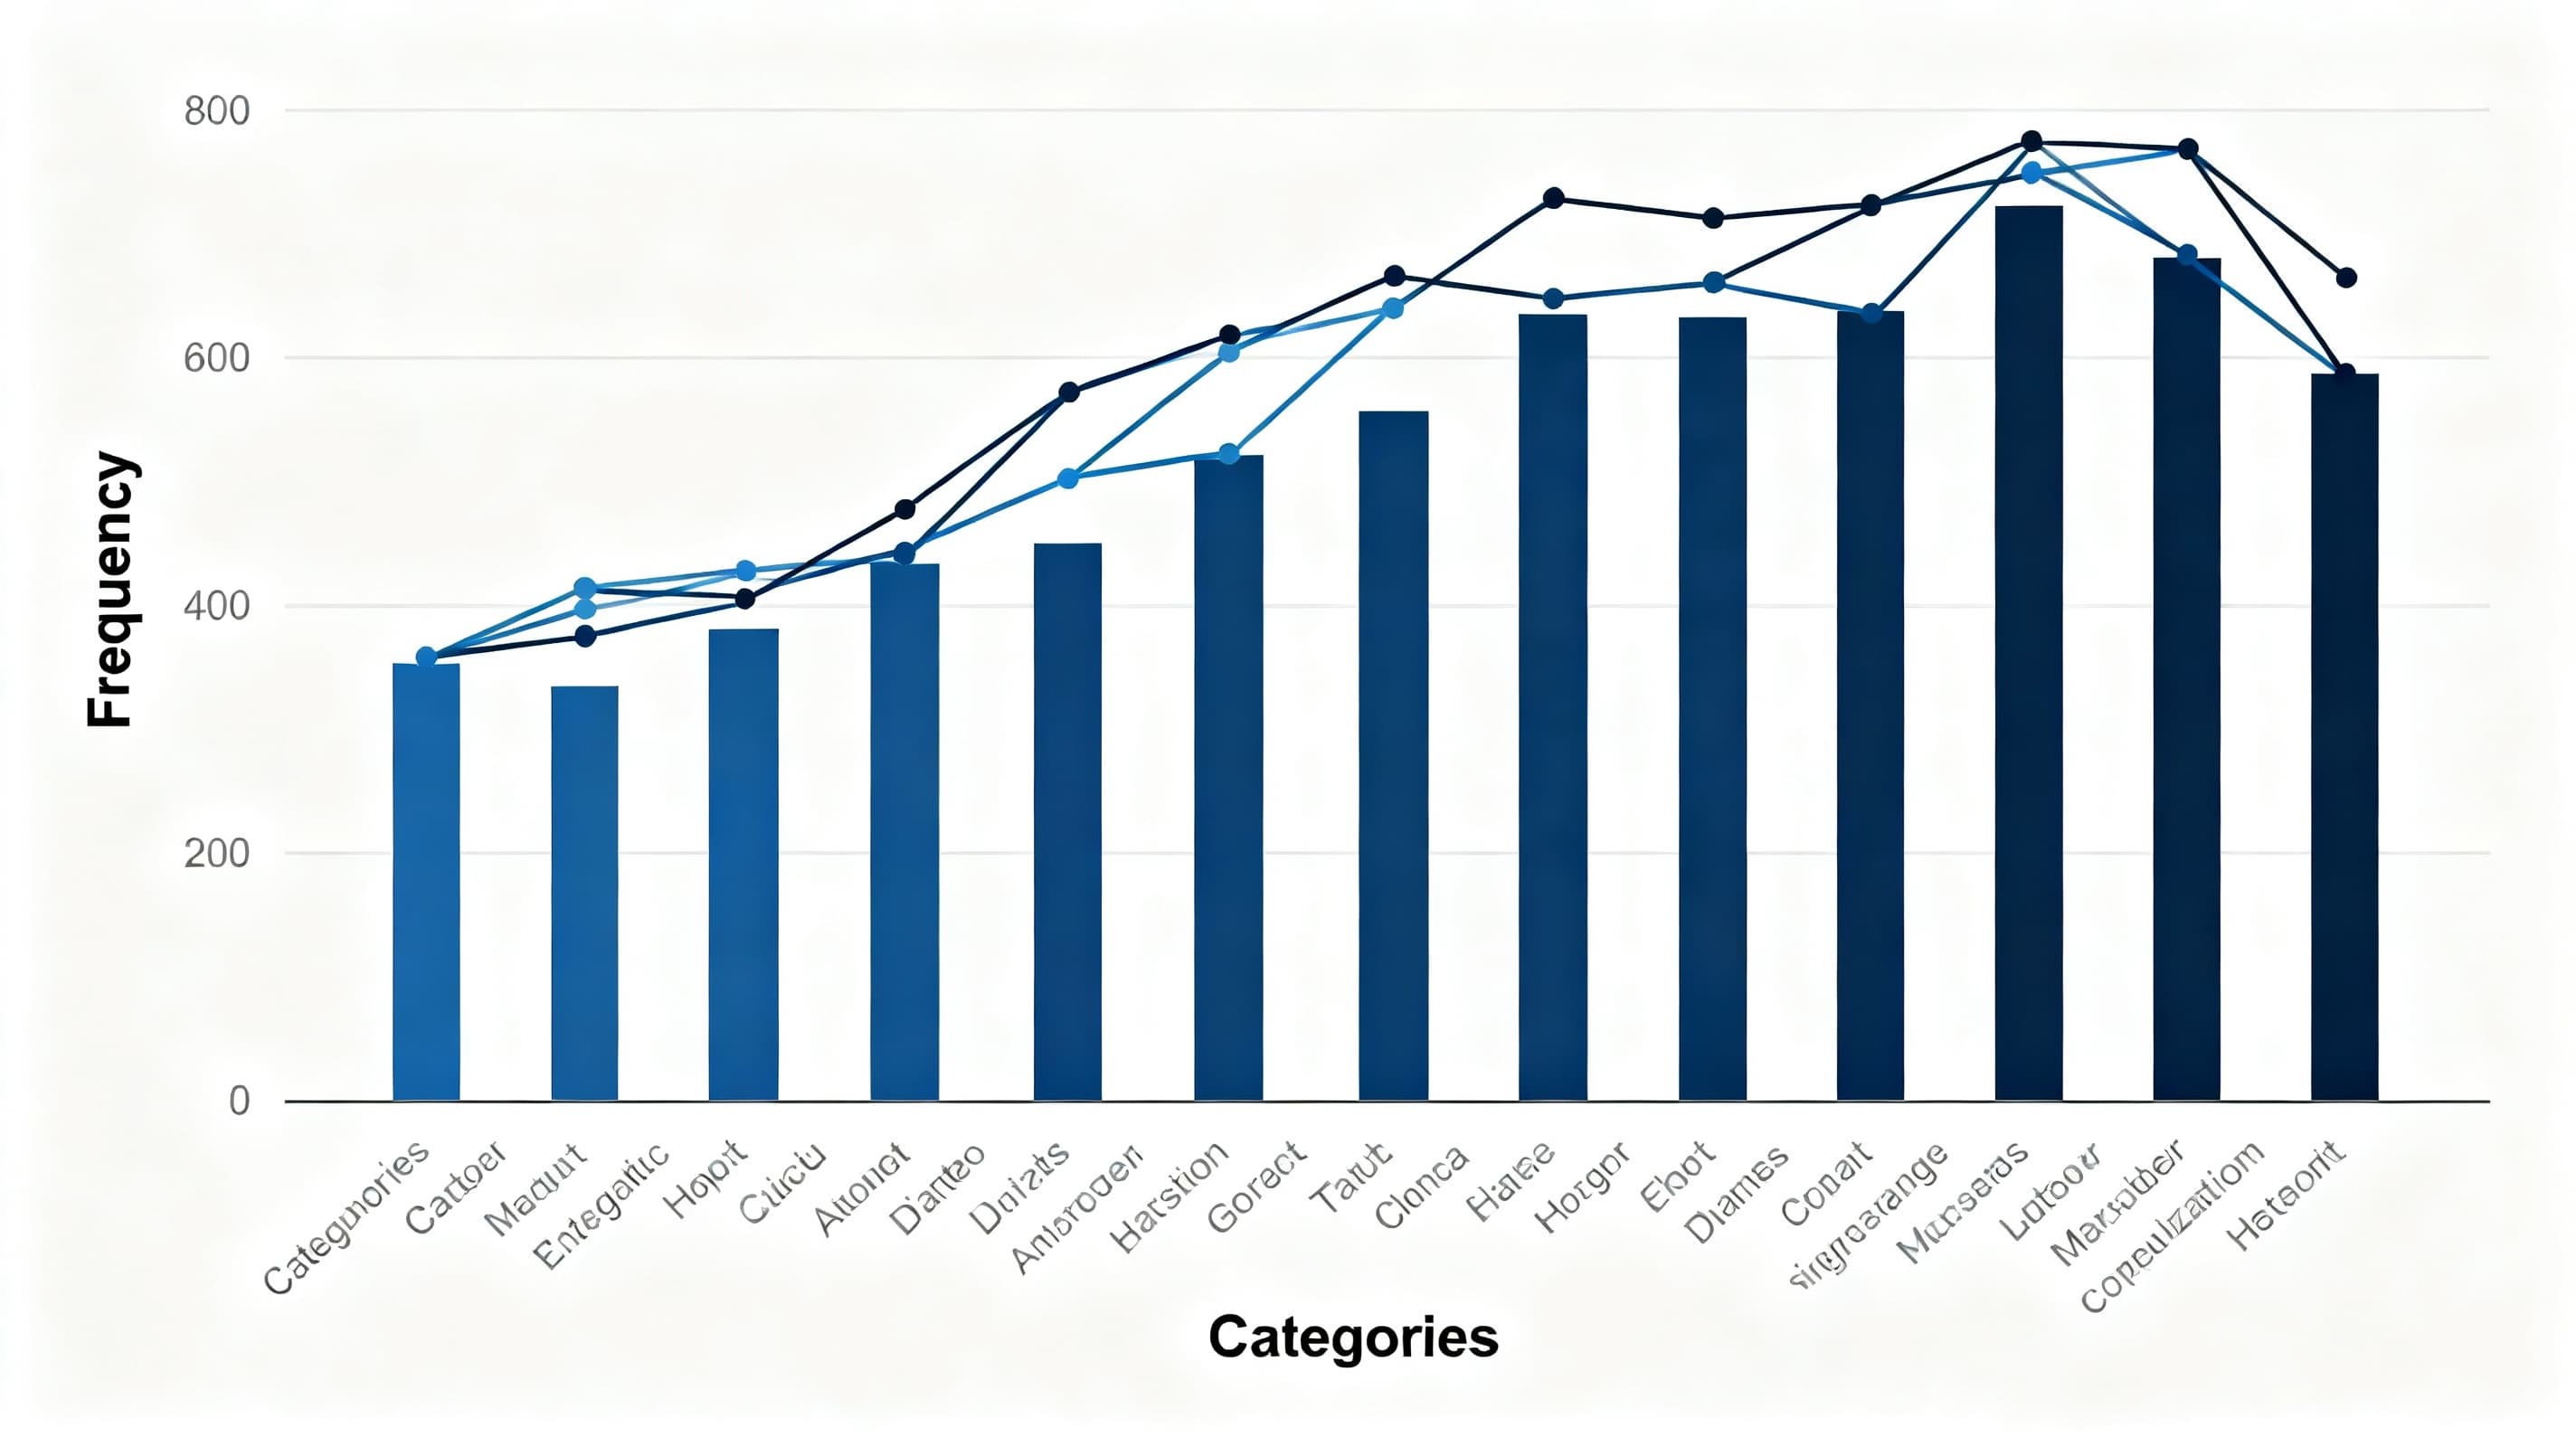
Understanding Line Histograms: Visualizing Data Distributions Effectively
Discover how line histograms combine the best of histograms and line charts to reveal data distributions, patterns, and insights with exceptional clarity.
Read the story
Use Line Charts to Visualize Trends Over Time
Discover why line charts are essential for tracking changes, identifying patterns, and telling compelling data stories through time.
Read the story
Why Bar Charts Are Best for Comparing Categories
Discover why bar charts are the go-to choice for comparing categories effectively.
Read the story
How to Choose the Right Chart for Your Data
Discover the right tool for every visualization challenge
Read the story
Top 10 Datasets to Elevate Your Game in Data Analysis
Read the story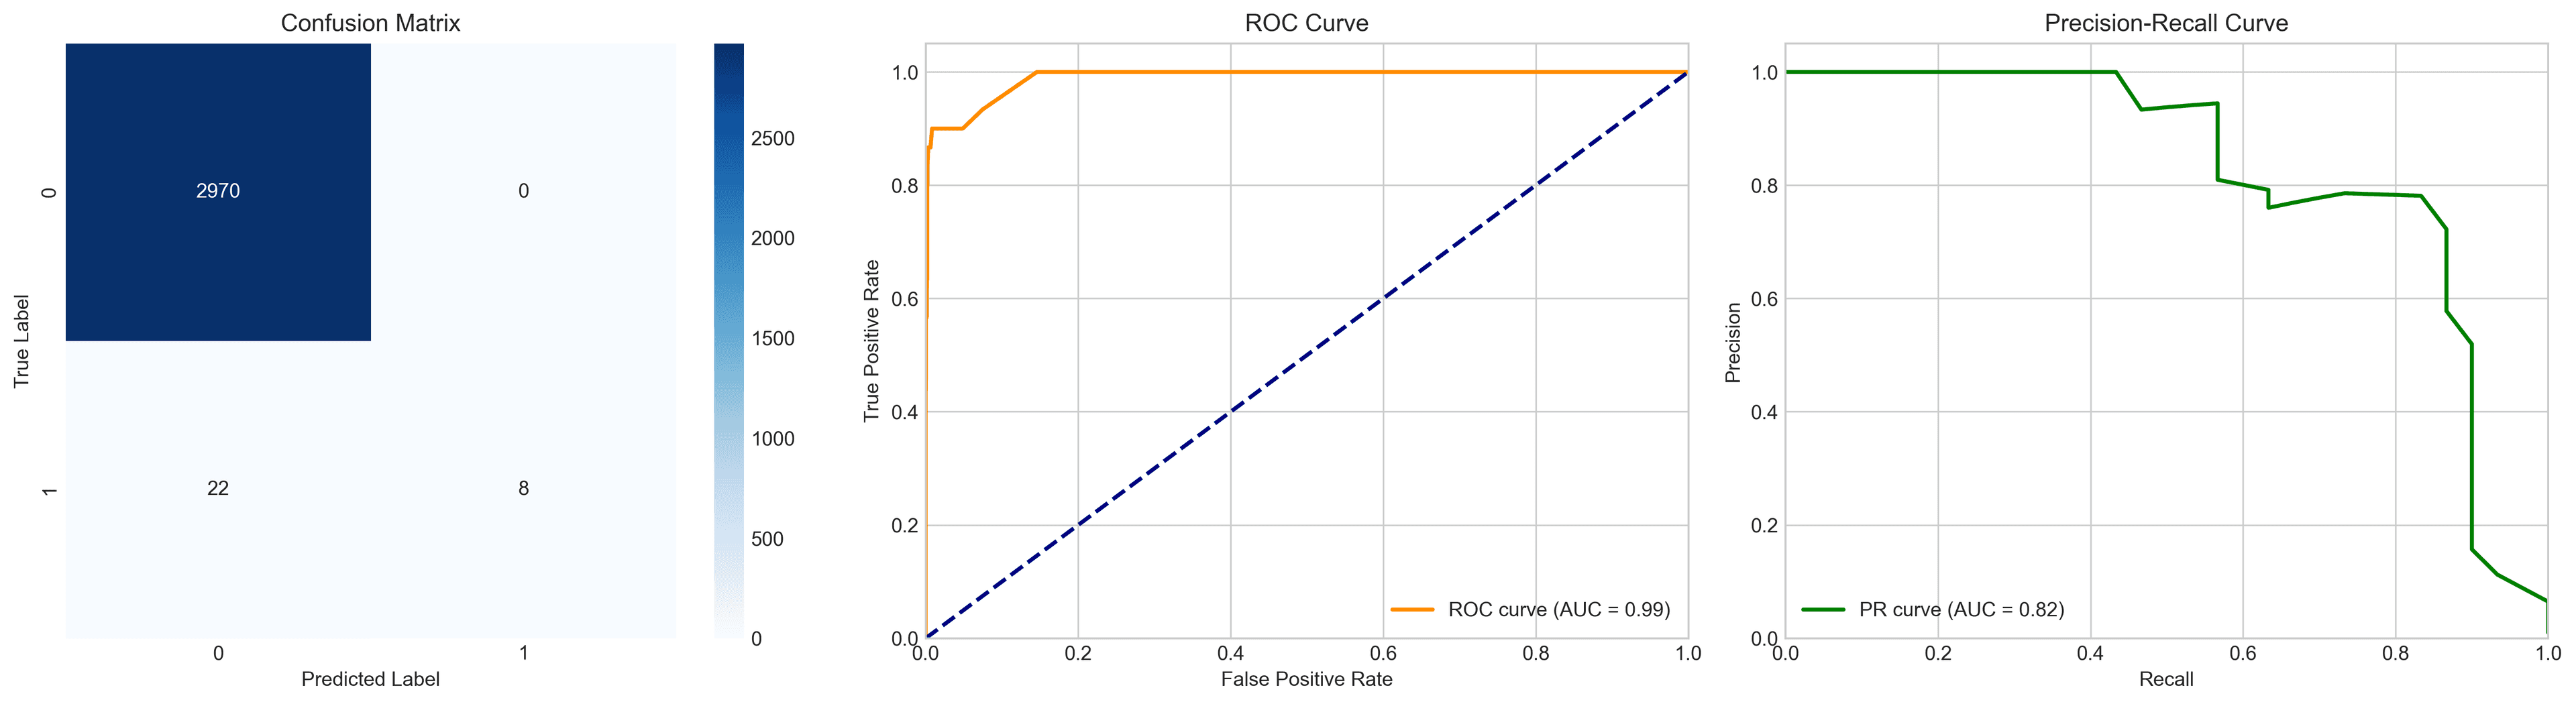
Using AI to Detect Fraudulent Financial Transactions
Read the story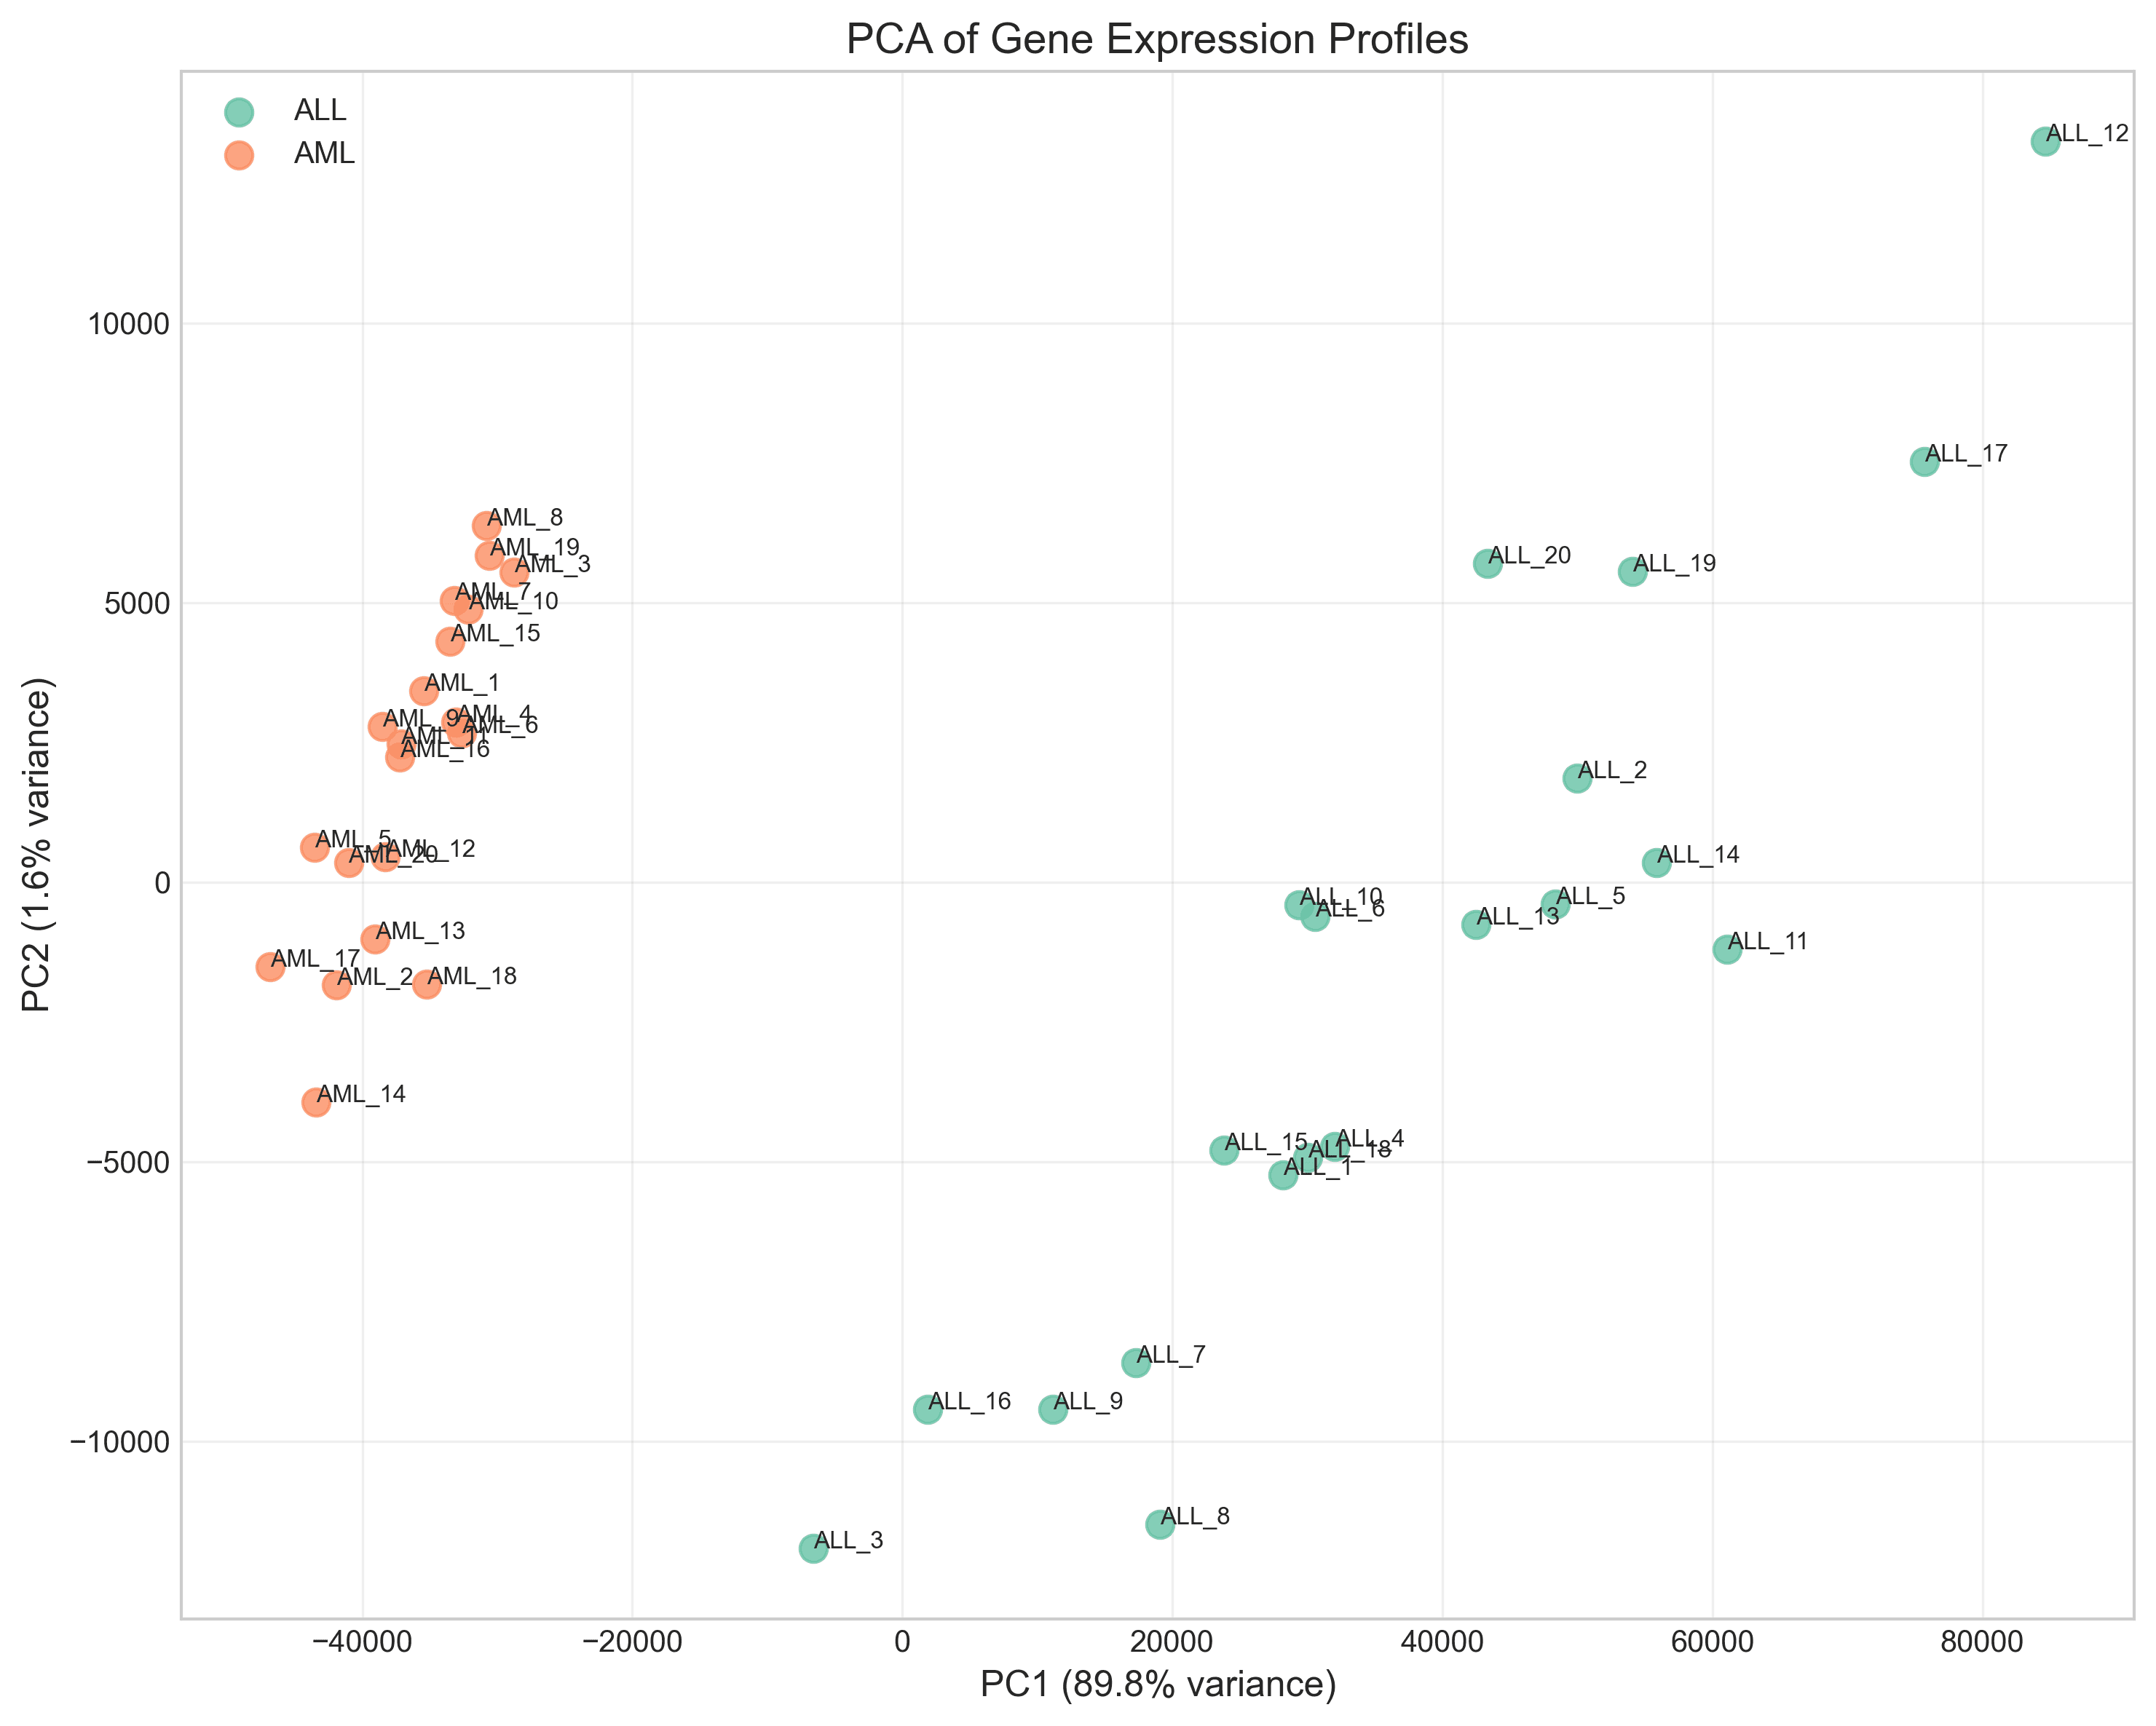
Leveraging AI for Genetic Research
Read the story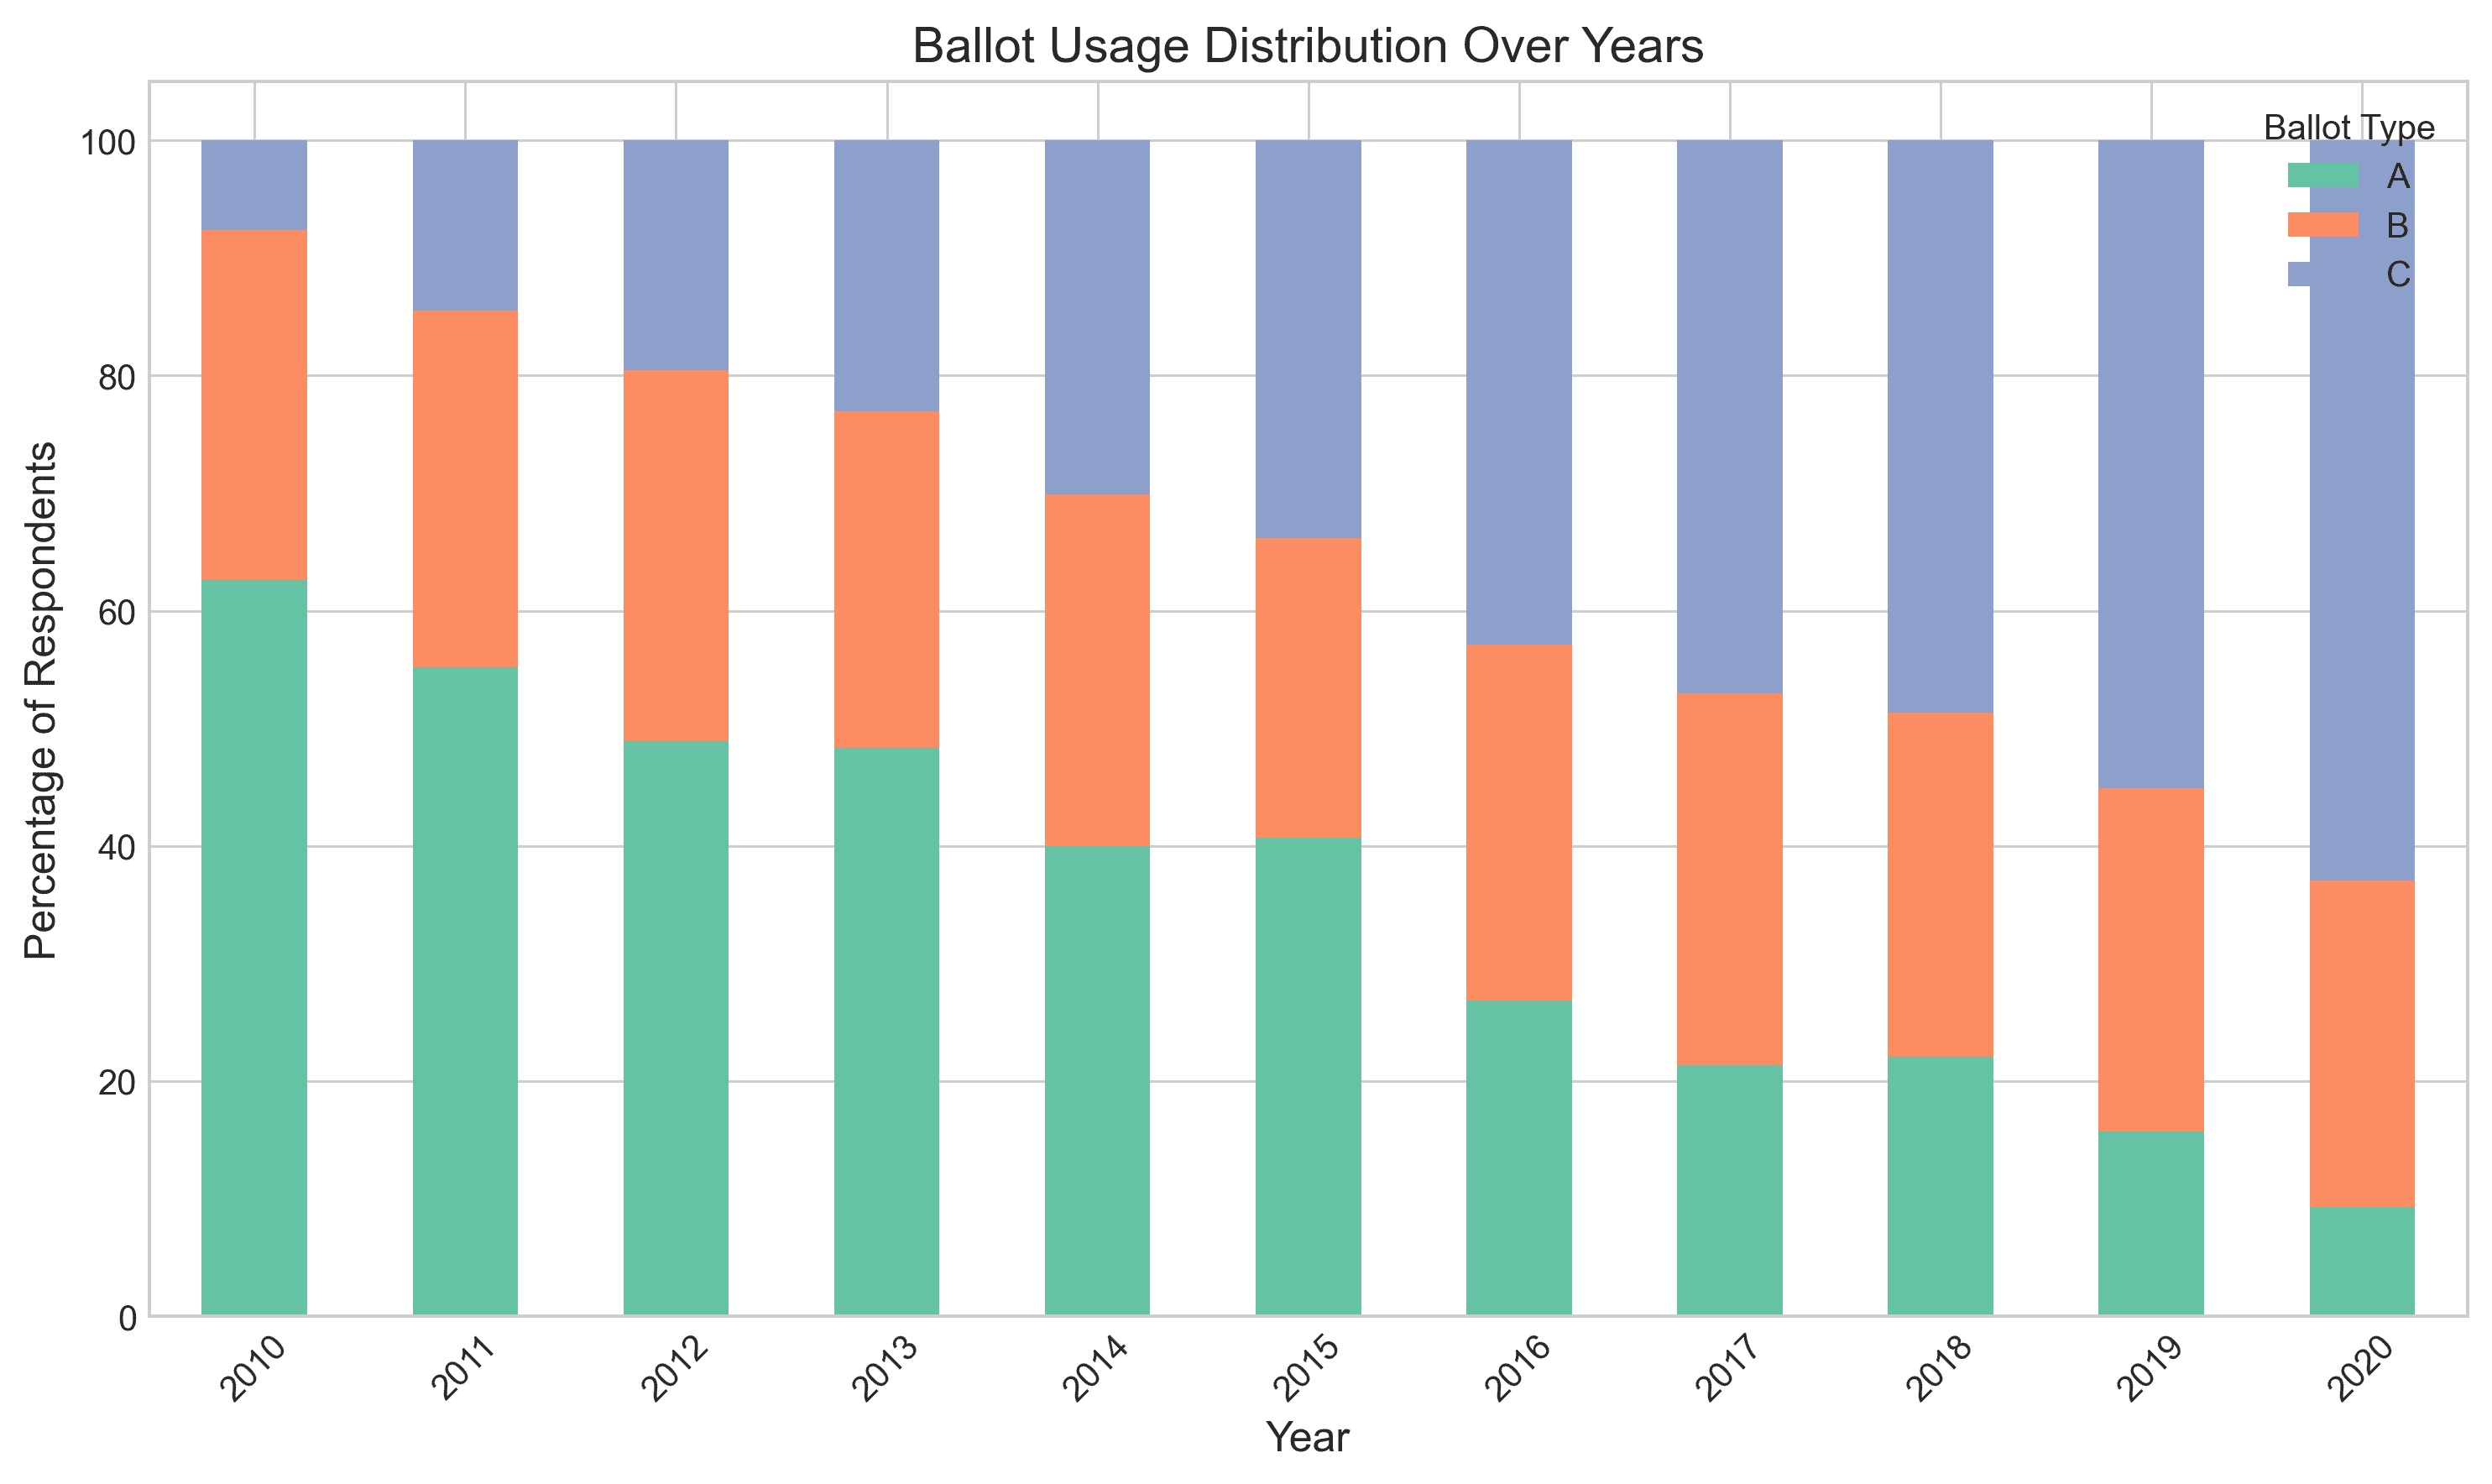
Leveraging AI for Sociology Research
Read the story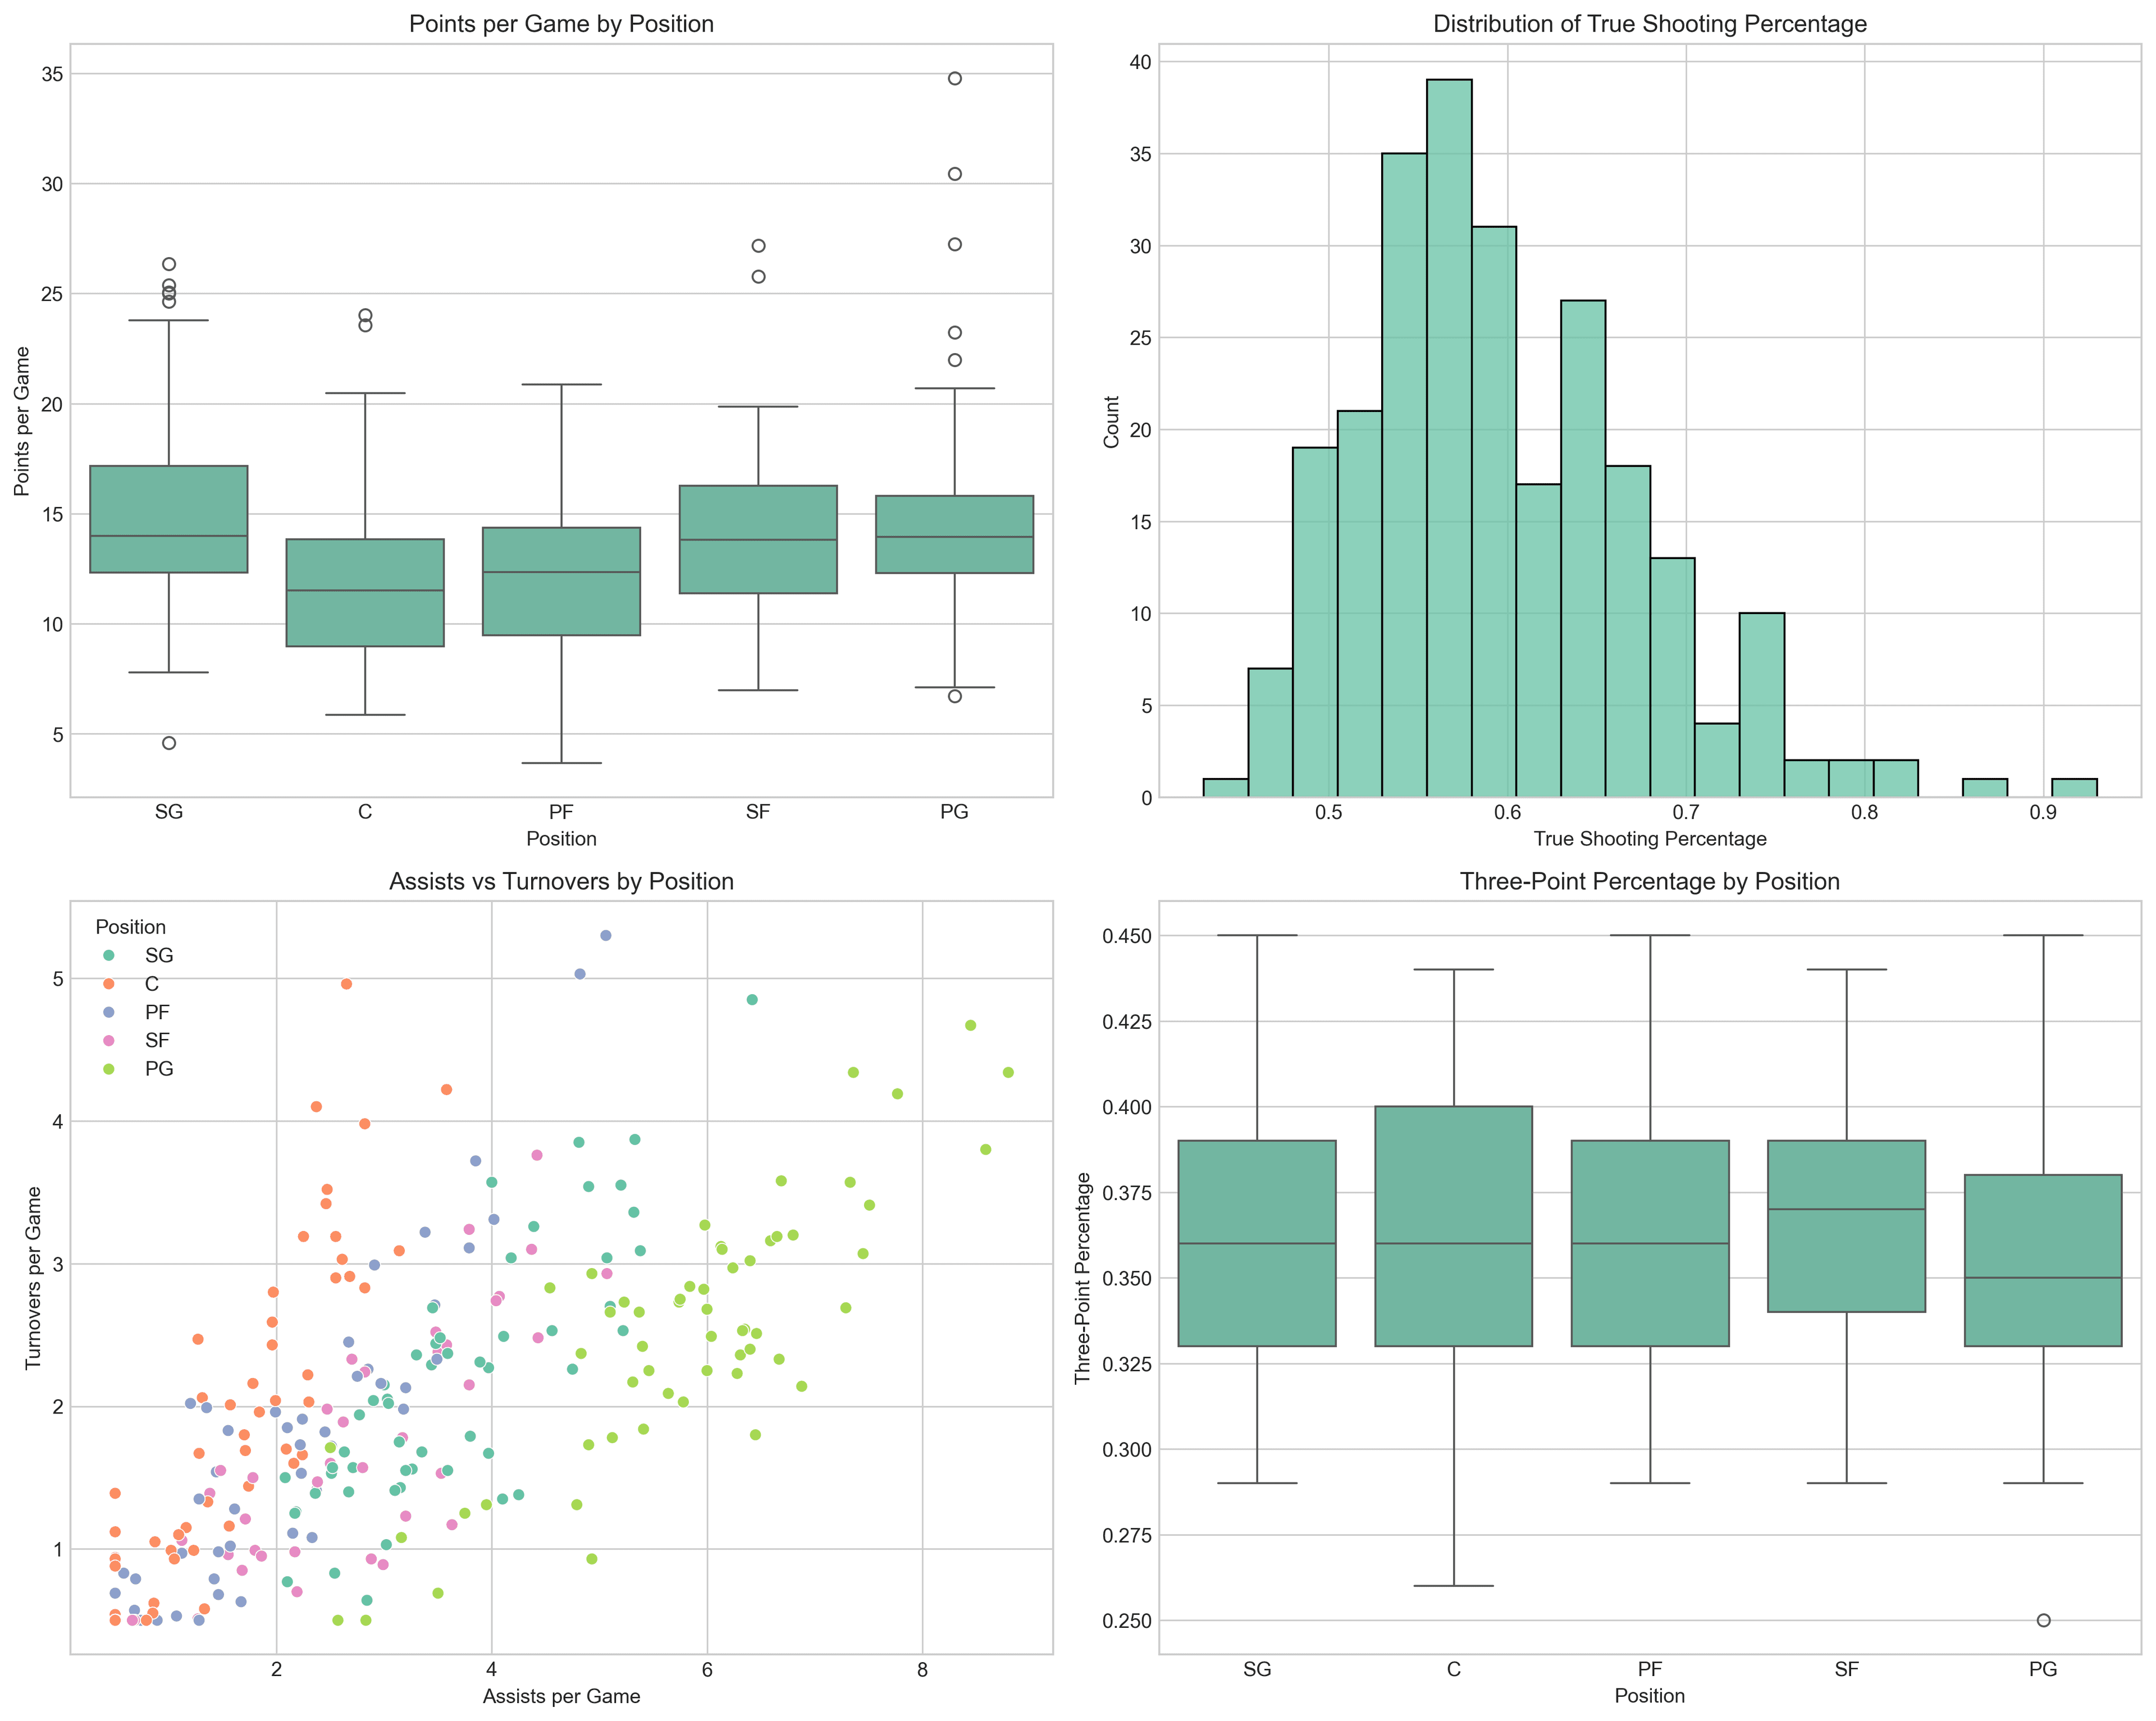
Sports Analytics Made Simple with AI
Read the story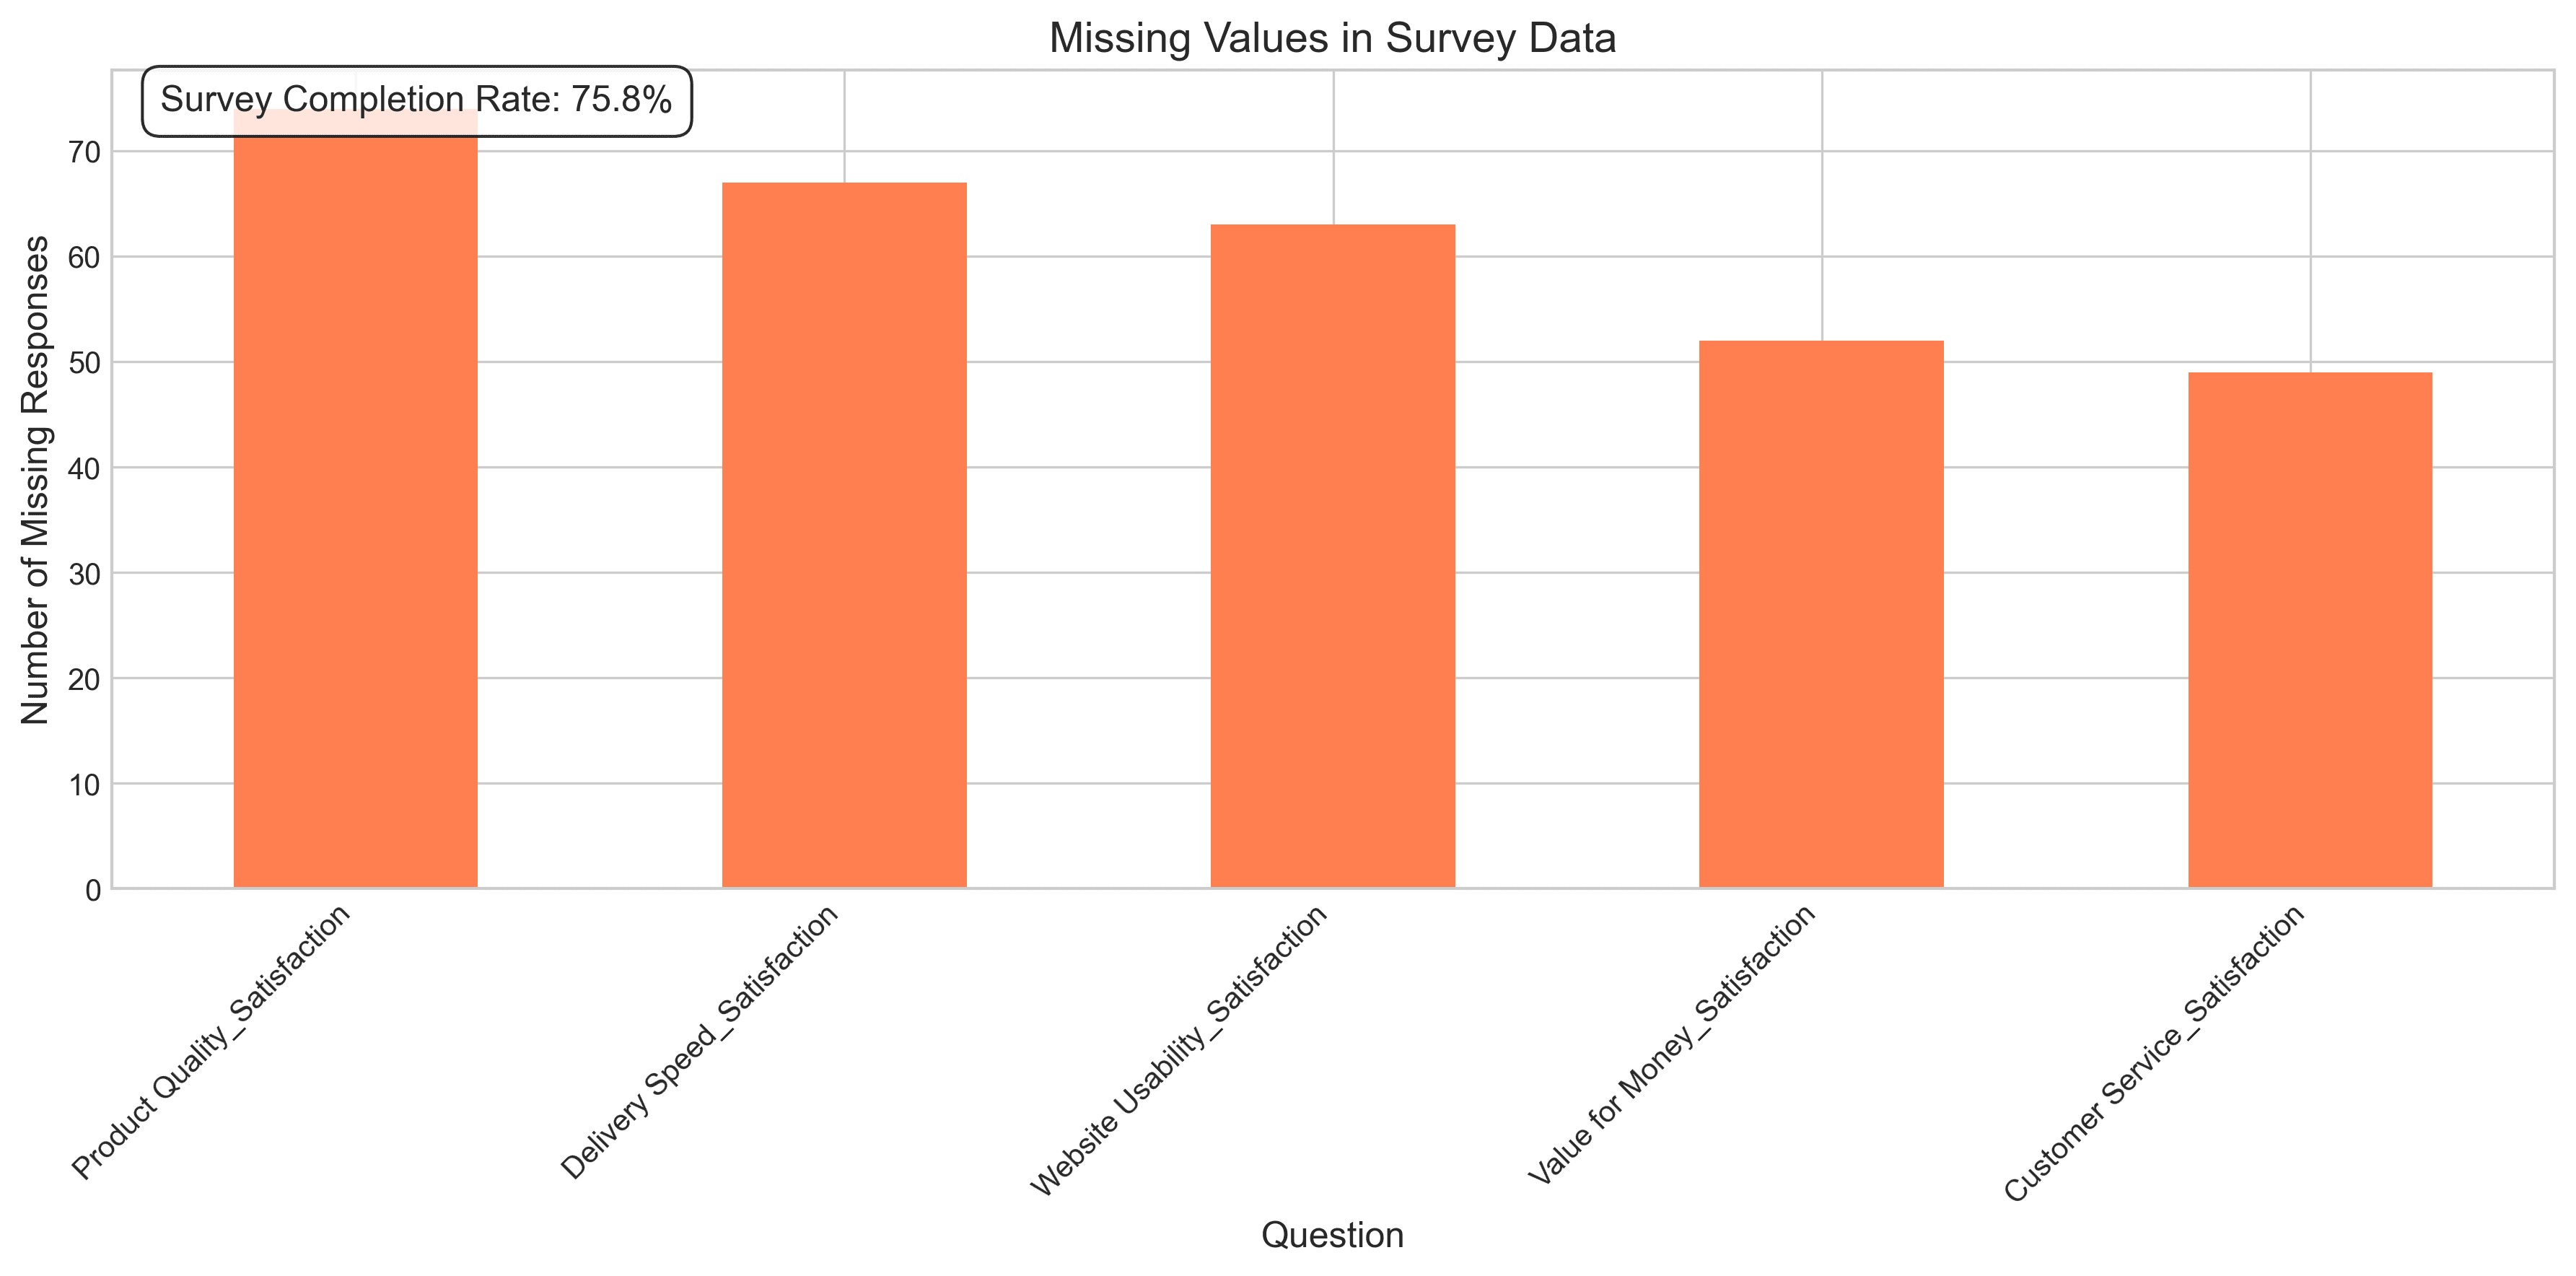
Analyzing Statistical Surveys with AI
Read the story
Pie Charts No More?
Read the story
How to Analyze Basketball Player Performance and Predict MVP Awards
Using advanced formulas
Read the story
How to stand out as a Data Analyst
Be the hero who's telling the story
Read the story8 Python Visualization Libraries Every Data Expert Should Know
Discover the right tool for every visualization challenge
Read the story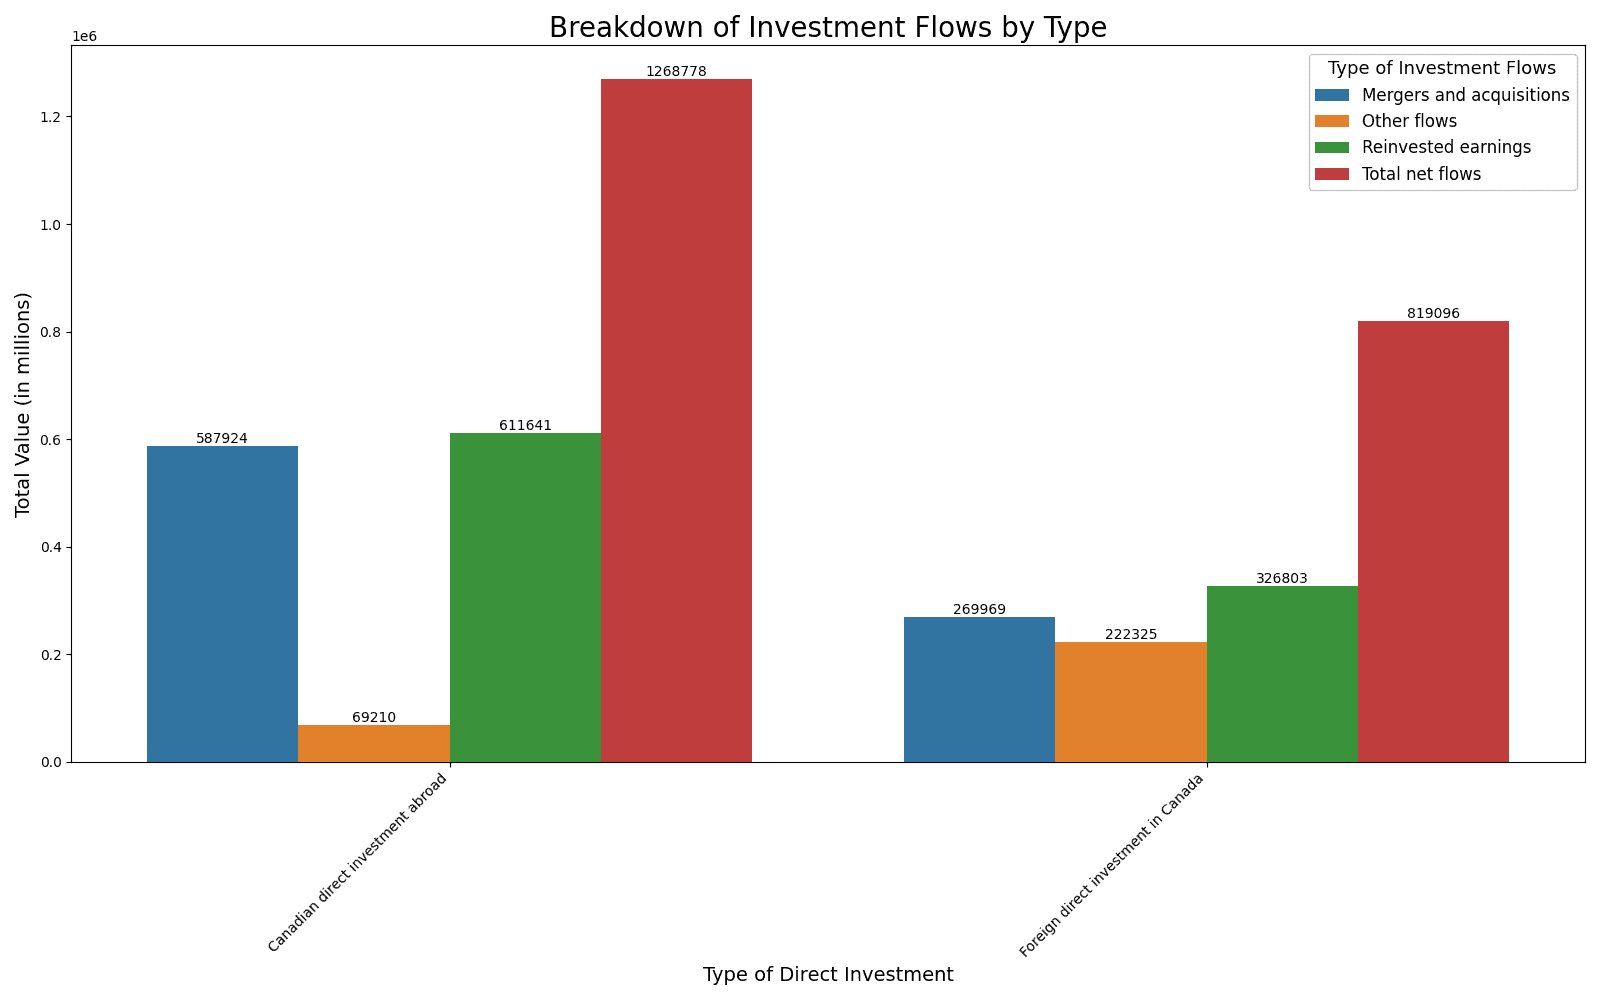
How to Quickly Analyze Any Discrete Time-Series Data with the Right Questions
Using Canadian investment flows and CPI as examples
Read the story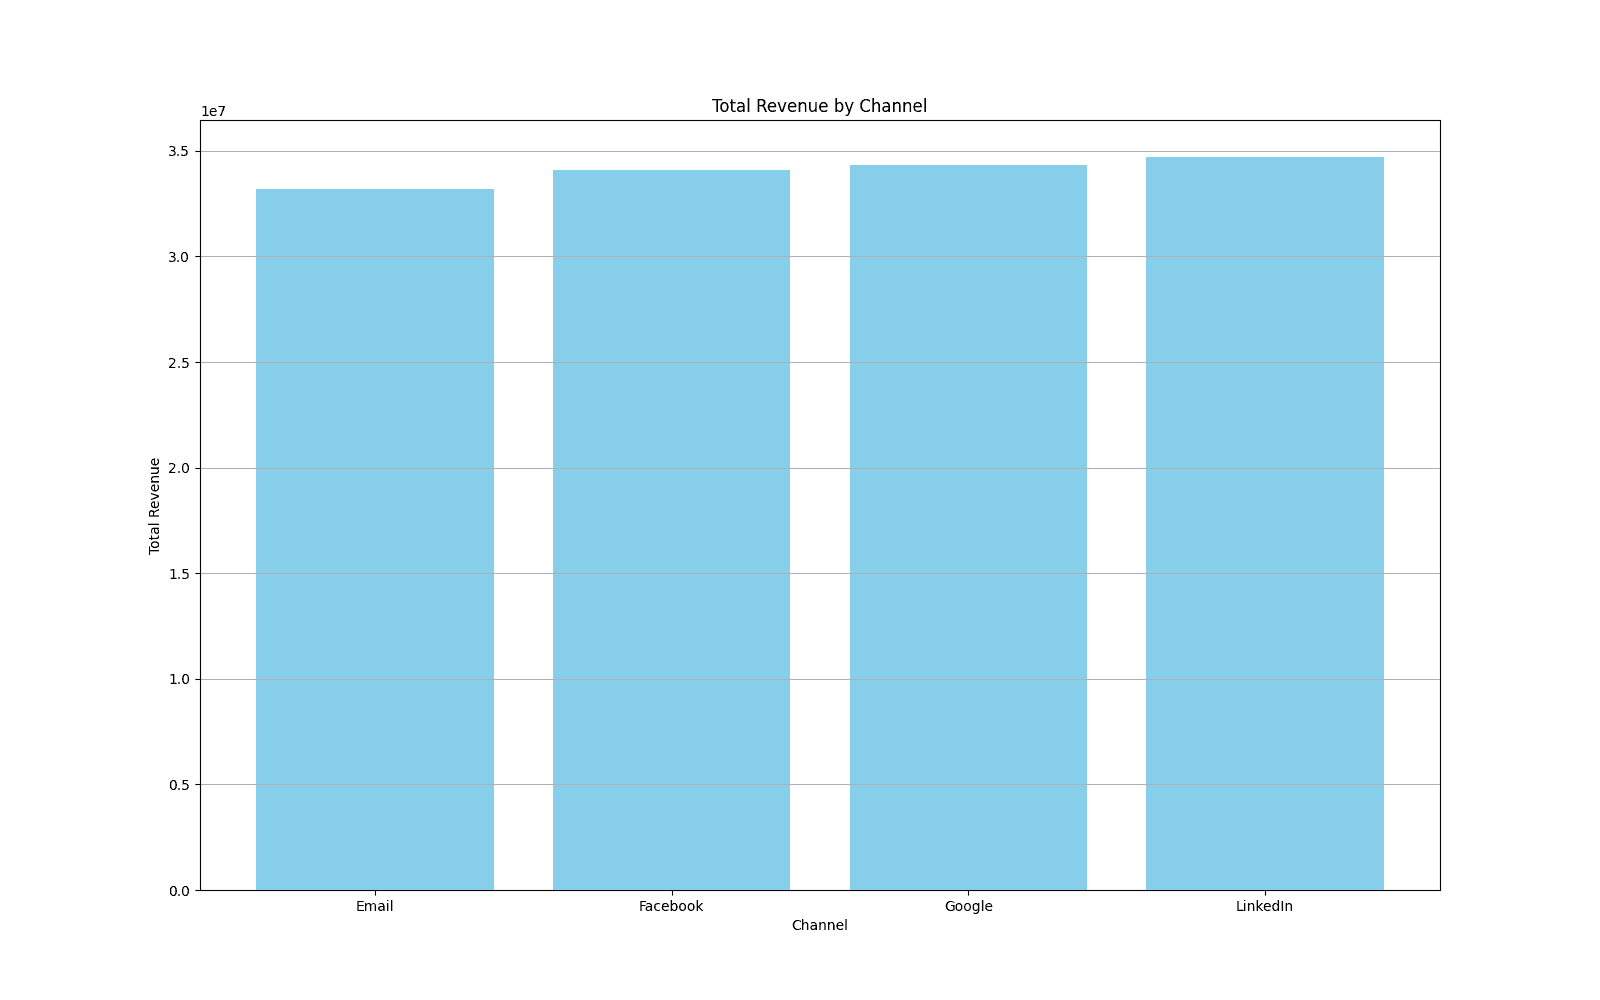
How to Analyze Your Marketing Campaigns in Minutes Using AI
No coding or data science expertise required
Read the story